The Changing Demographics of Winnipeg: Statistics, Growth, and Decline

Key Insights
| Based on statistics from the Winnipeg Townfolio, the population of the city in 2021 was 749,607, an increase of 6.3% compared to 705,244 in 2016. The World Population Review indicates that among the Prairie provinces, Manitoba’s 1.88% growth since 2022 is similar to Saskatchewan’s 1.44% and below Alberta’s 2.22%. Statistics Canada data reveals that Winnipeg’s population is relatively young, with a high proportion of citizens in the working-age bracket (20–64 years). Data from the World Population Review depicts how Winnipeg’s largest ethnic group is English at 21.1%, then Scottish (16.4%), Canadian (16.8%), and German (16.2%) in origin. The same report indicates that Christianity still holds the highest religious affiliation in Winnipeg, with 64% of people being Christian. |
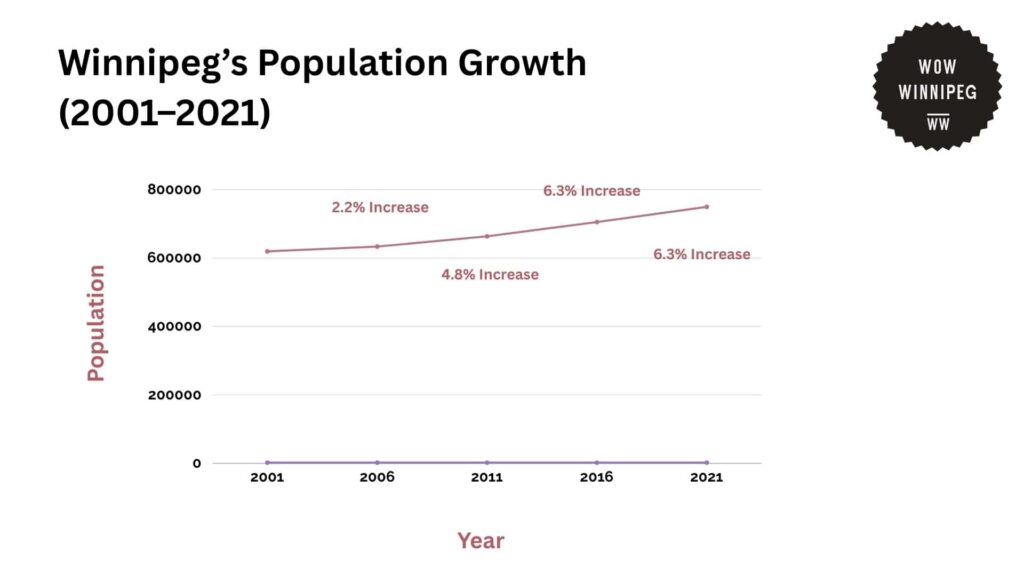
According to data from the Winnipeg Townfolio, Winnipeg’s population has steadily increased over the past two decades, reflecting broader trends in urban growth across Canada.
The city’s population reached 749,607 in 2021, marking a 6.3% increase from 705,244 in 2016. This follows a 6.3% rise between 2011 and 2016, when the population grew from 663,617 to 705,244.
Since 2001, Winnipeg has added 130,063 residents, representing a 21% growth over two decades.
As the population keeps growing, the city’s growth rate has also been constant since 2011, at approximately 6.3% per census cycle.
Prior to that, growth was slower, with only a 2.2% growth between 2001 and 2006 and 4.8% between 2006 and 2011.
Immigration trends have driven the growth of the city, with immigrants comprising most of the new residents. However, demographic factors like a growing population and decreased fertility rates could slow down future growth.
| Census Year | Population | Population Increase (%) |
| 2001 | 619,544 | — |
| 2006 | 633,451 | 2.2% |
| 2011 | 663,617 | 4.8% |
| 2016 | 705,244 | 6.3% |
| 2021 | 749,607 | 6.3% |
Regional Analysis of Demographic Trends Across Canada
The World Population Review gives insights into demographic trends across different regions in Canada.
| Province | 2024 Population | 2022 Population | 2016 Population | 2011 Population | % Change (2022-2024) |
| Ontario | 15,996,989 | 15,262,660 | 13,448,494 | 12,851,821 | 2.19% |
| Quebec | 9,030,684 | 8,751,352 | 8,164,361 | 7,903,000 | 1.27% |
| British Columbia | 5,646,467 | 5,368,266 | 4,648,055 | 4,400,057 | 2.46% |
| Alberta | 4,849,906 | 4,601,314 | 4,067,175 | 3,645,257 | 2.22% |
| Manitoba | 1,484,135 | 1,420,228 | 1,278,365 | 1,208,268 | 1.88% |
| Saskatchewan | 1,231,043 | 1,205,119 | 1,098,352 | 1,053,960 | 1.44% |
| Nova Scotia | 1,072,545 | 1,030,953 | 923,598 | 921,727 | 1.89% |
| New Brunswick | 850,894 | 820,786 | 747,101 | 751,171 | 1.64% |
| Newfoundland | 541,391 | 528,818 | 519,716 | 514,536 | 0.51% |
| Prince Edward Island | 177,081 | 172,707 | 142,907 | 140,204 | 2.72% |
| Yukon | 45,750 | 43,964 | 35,874 | 33,897 | 3.09% |
| Northwest Territories | 44,920 | 45,602 | 41,786 | 41,462 | 0.91% |
| Nunavut | 40,758 | 40,586 | 35,944 | 31,906 | 1.58% |
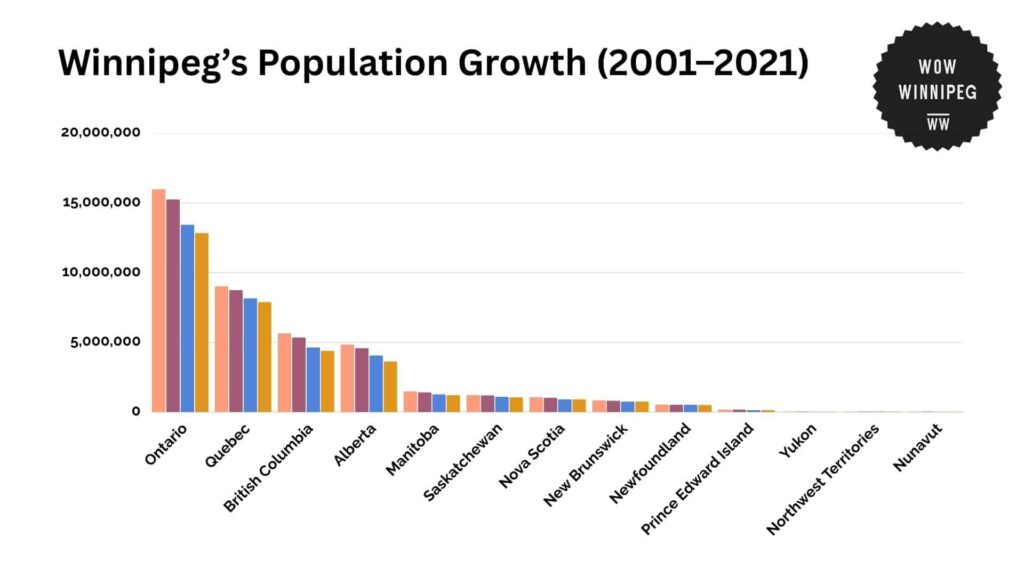
Of the Prairie provinces, Manitoba’s growth rate of 1.88% since 2022 is comparable to Saskatchewan’s 1.44% and just below Alberta’s 2.22%.
Even with Manitoba’s consistent growth, it is still slower than that of Alberta and British Columbia but faster than provinces such as New Brunswick (1.64%) and Newfoundland (0.51%).
Alberta is still among the quickest-growing provinces, having attracted 248,592 residents between 2022 and 2024. The province has raised its overall population to 4,849,906.
Saskatchewan, however, experienced more conservative growth, achieving 1,231,043 citizens in 2024, up by 25,924 individuals from 2022.
On the other hand, British Columbia has witnessed one of the highest rates of growth, growing by 2.46% to 5,646,467 citizens in 2024. The province gained 278,201 individuals in two years, with most of the growth coming from immigration.
Ontario, Canada’s largest province at 15.99 million persons in 2024, gained 734,329 more people compared to 2022 – an increase of 2.19%.
Small provinces like Prince Edward Island and Yukon registered among the fastest increase rates.
Prince Edward Island’s population increased by 2.72% to 177,081 residents, and Yukon’s population increased by 3.09% to 45,750 residents, making it the fastest-growing area in Canada.
Conversely, Newfoundland and Labrador registered the slowest growth, gaining only 12,573 residents (0.51%) since 2022, as it continues to struggle with out-migration and an aging population.
Age Group Demographics in Winnipeg
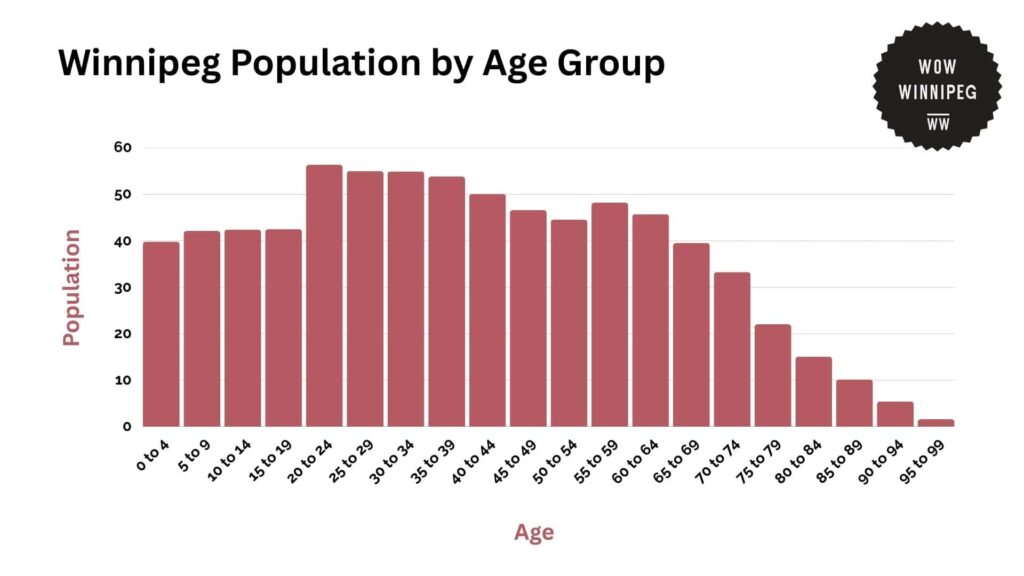
Data from Statistics Canada shows that Winnipeg’s population is comparatively young, with a significant percentage of citizens in the working-age group (20–64 years old).
The largest age group is 20 to 24 years, with 56,365 citizens. This is followed by the 25 to 29 age group (55,040) and the 30 to 34 age group (54,930).
Combined, people aged 20 to 39 make up roughly 26% of Winnipeg’s population, which is indicative of the city’s attraction to young professionals, students, and new entrants to the workforce.
Children and youths (ages 0 to 19) also constitute a large percentage of the population, with more than 166,840 inhabitants in this group.
The largest age bracket of children is between 15 and 19 years with 42,490 people, slightly above the 10 to 14 (42,410) and 5 to 9 (42,130) brackets.
Meanwhile, the 0 to 4 year bracket is the lowest of this group with 39,810 inhabitants, indicating a progressive decline in birth rates over time.
Older persons (65 and older) are a rising group of people in Winnipeg. Currently, there are 39,550 people in the 65 to 69 age group and 33,270 people aged 70 to 74.
The population continues to drop by age group from there, with 22,205 people in the 75 to 79 age group and only 5,425 people in the 90 to 94 age group.
The oldest age group (95 to 99 years) consists of 1,585 persons, reflecting rising life expectancy but also the relatively modest number of the city’s most elderly.
| Age Group | Population |
| 0 to 4 | 39,810 |
| 5 to 9 | 42,130 |
| 10 to 14 | 42,410 |
| 15 to 19 | 42,490 |
| 20 to 24 | 56,365 |
| 25 to 29 | 55,040 |
| 30 to 34 | 54,930 |
| 35 to 39 | 53,845 |
| 40 to 44 | 50,115 |
| 45 to 49 | 46,635 |
| 50 to 54 | 44,555 |
| 55 to 59 | 48,230 |
| 60 to 64 | 45,735 |
| 65 to 69 | 39,550 |
| 70 to 74 | 33,270 |
| 75 to 79 | 22,025 |
| 80 to 84 | 15,050 |
| 85 to 89 | 10,155 |
| 90 to 94 | 5,425 |
| 95 to 99 | 1,585 |
Breakdown of Demographics in Winnipeg
Ethnic Origins
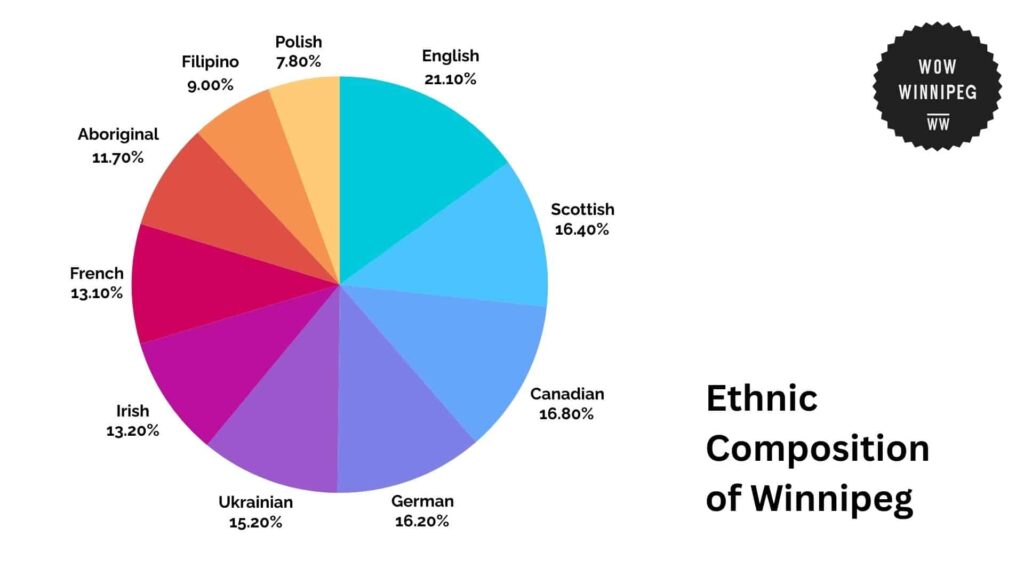
The World Population Review illustrates how Winnipeg’s population comprises a diverse pool of European, Indigenous, and visible minority communities that form its cultural base.
The predominant ethnic group is English at 21.1%, followed by Scottish (16.4%), Canadian (16.8%), and German (16.2%) origins.
A notable proportion of residents are also of Ukrainian (15.2%), Irish (13.2%), and French (13.1%) descent, tracing the city’s strong historical connection to European immigration.
Winnipeg also boasts one of the highest urban Indigenous populations in Canada, with 11.7% of its residents claiming to be Aboriginal.
Moreover, the city also has a very rapidly expanding Filipino population, now making up 9.0% of the city’s residents. This group is also the largest visible minority group in Winnipeg.
| Ethnic Group | Percentage of Population |
| English | 21.10% |
| Scottish | 16.40% |
| Canadian | 16.80% |
| German | 16.20% |
| Ukrainian | 15.20% |
| Irish | 13.20% |
| French | 13.10% |
| Aboriginal | 11.70% |
| Filipino | 9.00% |
| Polish | 7.80% |
Religious Affiliation
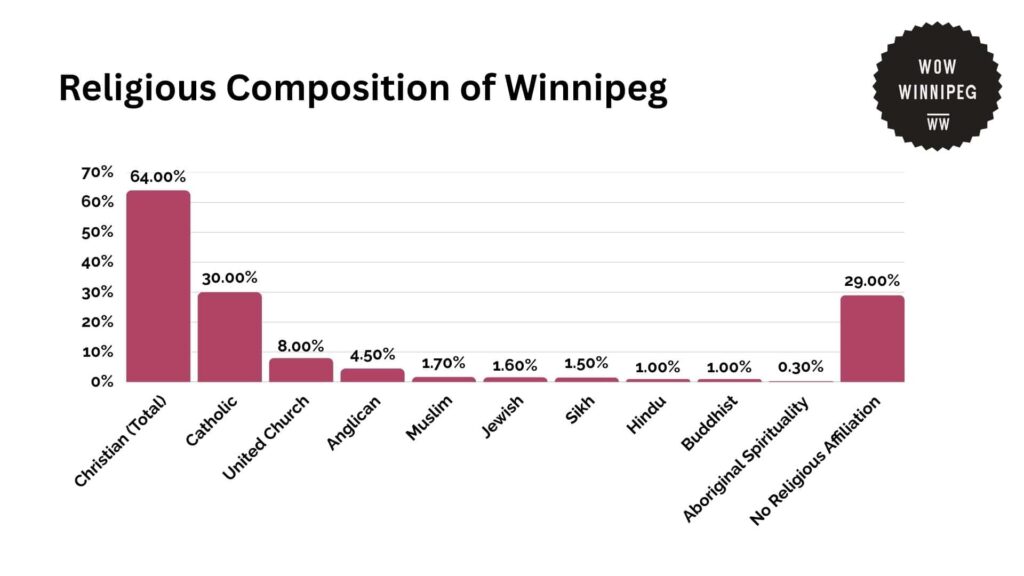
According to the National Household Survey, Christianity remains the dominant religion in Winnipeg, with 64% of the population identifying as Christian.
Among them, 30% are Catholic, 8% belong to the United Church, and 4.5% identify as Anglican.
Other Christian denominations make up smaller portions of the population, contributing to the city’s religious landscape.
Moreover, religious diversity is also increasing, with growing communities of Muslims (1.7%), Jews (1.6%), Sikhs (1.5%), Hindus (1%), and Buddhists (1%).
Winnipeg also has 0.3% of residents practicing Aboriginal spirituality, a reflection of Indigenous cultural traditions.
Meanwhile, secularism is on the rise, with 29% of the population reporting no religious affiliation, aligning with broader trends of declining religious observance across Canada.
| Religion | Percentage of Population |
| Christian (Total) | 64.00% |
| – Catholic | 30.00% |
| – United Church | 8.00% |
| – Anglican | 4.50% |
| Muslim | 1.70% |
| Jewish | 1.60% |
| Sikh | 1.50% |
| Hindu | 1.00% |
| Buddhist | 1.00% |
| Aboriginal Spirituality | 0.30% |
| No Religious Affiliation | 29.00% |
Costs and Consequences of Slow Growth Rates in Winnipeg
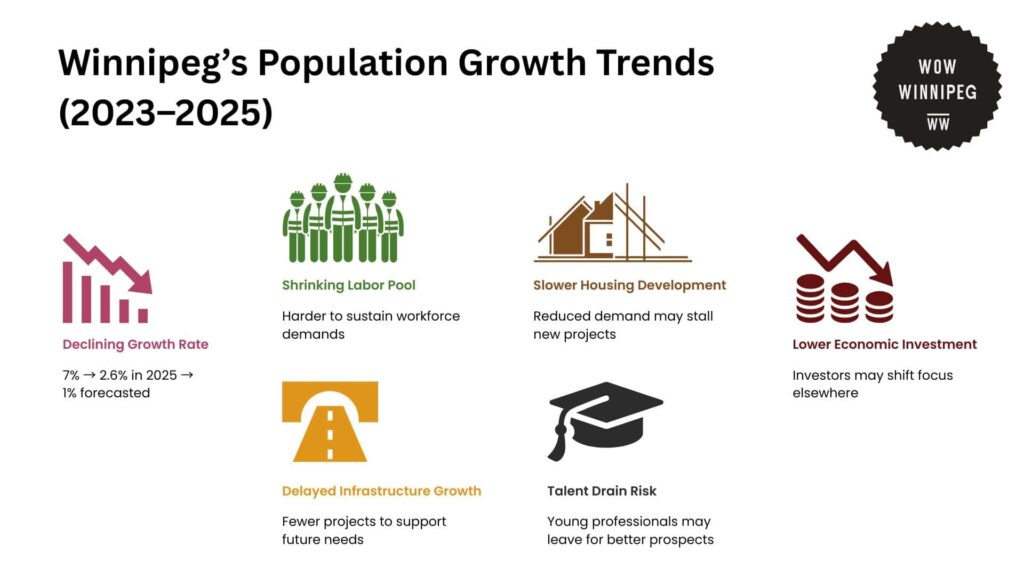
CBC News reports that in recent years, Winnipeg has experienced strong growth, at 7% over the last two years.
Recent data forecasts, however, suggest the trend will level off, and growth will dwindle to 2.6% in 2025 before falling further to about 1% in the following years.
A slowing rate of growth poses economic and social issues, especially since the city uses population growth to support its labor force, real estate market, and public infrastructure.
Moreover, slower population growth would affect demand for real estate, influencing housing construction and decreasing investment in new infrastructure development.
As growth is anticipated to dip below 1% in the foreseeable future, Winnipeg might also struggle with attracting and keeping young professionals as economic prospects become increasingly competitive with other cities in Canada that are growing faster.
Interventions and Solutions to Slow Growth Rates in Winnipeg
To offset Winnipeg’s slowing population growth, strategic measures are necessary to attract and retain residents.
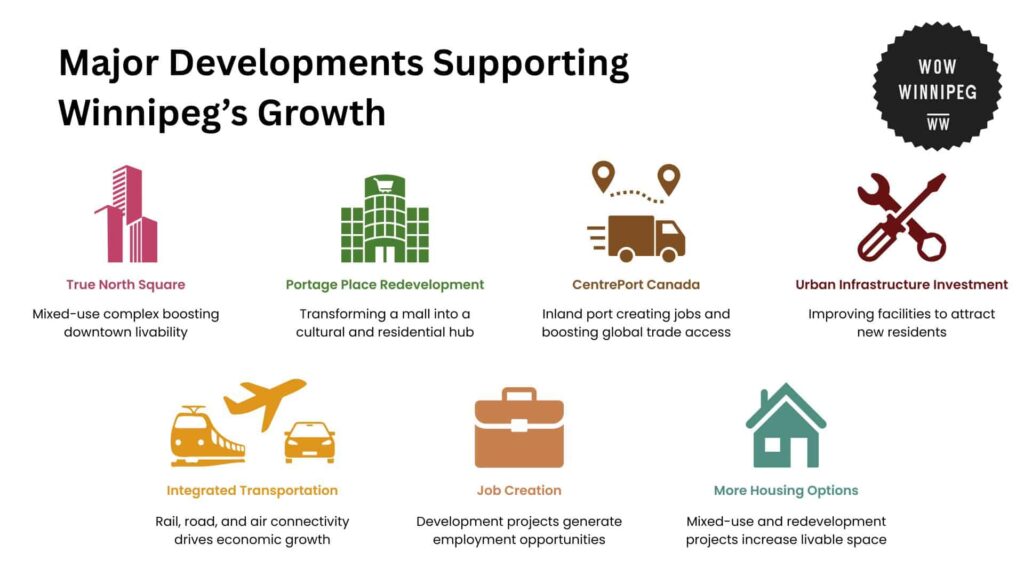
One such measure includes investing in urban development initiatives that make the city more attractive and livable.
An example of this is the current development of True North Square, a mixed-use complex with office space, residential space, retail stores, and public plazas, to revitalize downtown Winnipeg and build a thriving community hub.
Similarly, the planned Portage Place redevelopment will convert an underused mall into a vibrant facility featuring residential, commercial, and cultural amenities, thus drawing diverse populations to the urban core.
Improving transportation infrastructure is also an important function in facilitating population growth.
This includes the development of CentrePort Canada, an inland port with tri-modal access to transportation by rail, air, and road. This initiative positions Winnipeg as a key logistics and distribution centre in North America.
Beyond stimulating economic activity, it also generates jobs and makes the city more appealing to prospective residents.
Projections for Winnipeg’s Demographics
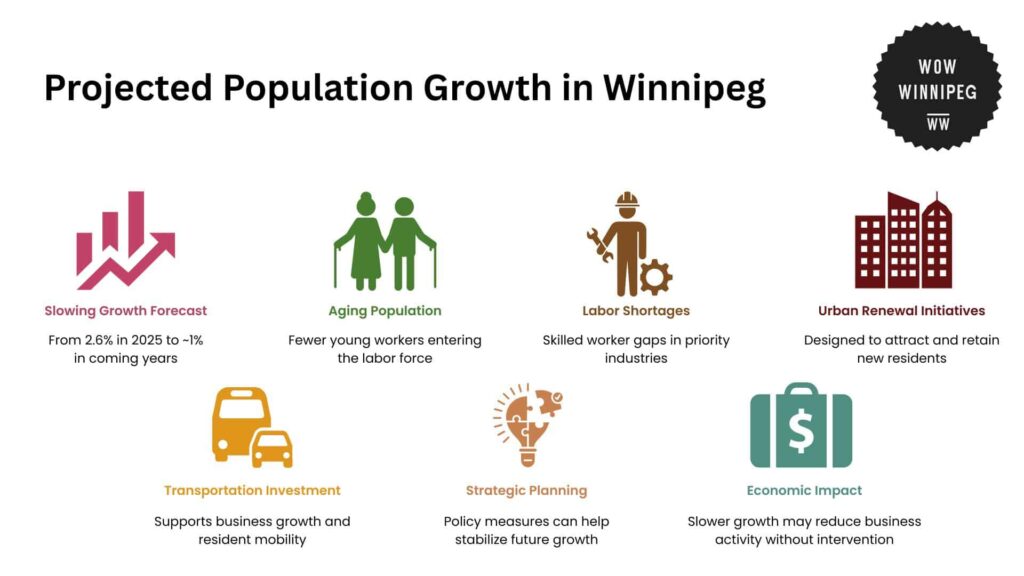
Winnipeg’s population expansion is anticipated to keep slowing down over time, decreasing from 2.6% in 2025 to approximately 1% in the next years.
If sustained, the city could experience longer-term issues tied to labor shortages, decreased economic activity, and an aging demographic.
A diminishing growth rate can lead to fewer young workers available to enter the workforce, contributing to skill shortfalls in high-priority sectors.
Urban renewal initiatives can serve to counteract some of these impacts by drawing more people to the city. Investment in transportation infrastructure may also help support business expansion and job growth.
While short-term growth might ease, strategic planning and policy measures could stabilize population dynamics during the coming decade.
References
- Townfolio. (n.d.). Winnipeg demographics. Retrieved from https://townfolio.co/mb/winnipeg/demographics
- World Population Review. (n.d.). Canadian provinces population 2024. Retrieved from https://worldpopulationreview.com/canadian-provinces
- Statistics Canada. (2021). Winnipeg population and demographics. Retrieved from https://www12.statcan.gc.ca/census-recensement/2021/dp-pd/prof/details/page.cfm?Lang=E&SearchText=winnipeg&GENDERlist=1&STATISTIClist=1&DGUIDlist=2021A00054611040&HEADERlist=0
- CBC News. (2024). Winnipeg’s population growth expected to slow in 2025. Retrieved from https://www.cbc.ca/player/play/video/9.6565385#:~:text=In%20recent%20years%2C%20Winnipeg%20has,1%20per%20cent%20next%20year.
- True North Real Estate Development. (2023). TNRED redevelopment plan backgrounder. Retrieved from https://www.tnse.com/wp-content/uploads/2023/05/TNRED-Redevelopment-Plan-Backgrounder_FINAL.pdf
- True North Square. (n.d.). True North Square. Retrieved from https://www.truenorthsquare.com/
- CentrePort Canada. (n.d.). CentrePort Canada – North America’s inland port. Retrieved from https://centreportcanada.ca/