Winnipeg Airport by the Numbers: Passenger Statistics and Financial Trends

Key Insights
| The Winnipeg Richardson International Airport (YWG) Airport Authority revealed that in 2024, they handled 4.3 million passengers, averaging 11,800 daily travelers. Data from Statistics Canada shows that Toronto Pearson International Airport recorded 43,716,866 passengers, which is 39,768,127 more than Winnipeg Richardson International Airport. According to Statistics Canada, YWG handled 3,948,739 total passengers in 2023, nearly one million more than in 2022. The Winnipeg Airport’s 2023 Financial Report indicates that in 2020, when passenger traffic declined to 1,235,260, revenue fell to $66.23 million. This is a $73.55 million decrease from 2019. The same report states that in 2023, YWG generated $163.86 million in revenue, its highest in five years, along with a net income of $14.86 million. |
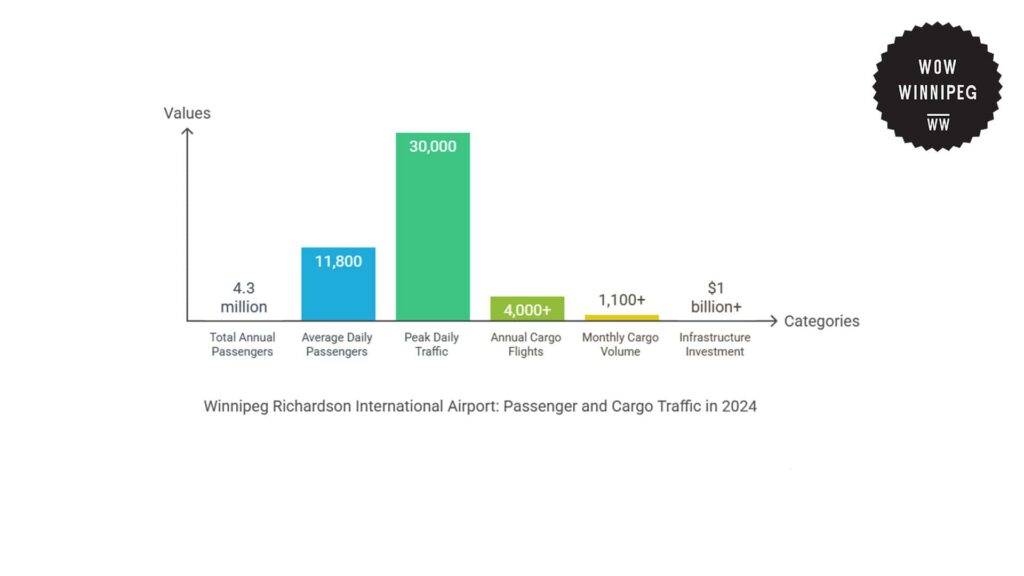
The Winnipeg Richardson International Airport (YWG) Airport Authority reported that they handled 4.3 million passengers during 2024, which is an average of 11,800 travelers per day.
Although this figure indicates constant passenger movement, some periods of the year experience dramatic increases.
August was the airport’s busiest month, primarily because it was the summer holiday season, with more vacationers, and students traveling.
Meanwhile, the busiest single days at the airport are December 27 and 28, when about 30,000 travelers pass through during these two days.
This increase indicates a heavy seasonal trend influenced by the Christmas and New Year’s holidays, as vacationers travel back and forth from their destinations.
As these two days alone represent almost 2.5 times the daily average, airport facilities have to expand to meet the resulting increase in passengers.
In addition to the movement of passengers, the YWG also sees significant cargo activity. The airport accommodates more than 4,000 cargo movements per year, as they handle the transportation of more than 1,100 semi-trucks worth of cargo monthly.
This quantity highlights the status of the YWG as a primary logistics gateway in the region, as it supports the transportation of goods for business and supply chains throughout Manitoba.
With both passenger and freight activity, the airport has become an increasingly important facility for both Winnipeg and surrounding areas.
Due to this, investment in the airport’s infrastructure has become one of their long-term priorities.
Since 1997, more than $1 billion has been spent on developing and modernizing the airport facilities. This investment indicates the strategic value of the airport and the need to meet growing demands.
Furthermore, Runway 13/31 underwent major rehabilitation in 2019, making it usable for the next 12 to 15 years. Such improvements are required to ensure safety, operational effectiveness, and the airport’s capacity to handle both passenger and cargo flights.
All of these figures reveal the YWG’s increasing status as a regional transport hub, as it experiences consistent passenger traffic, seasonal peaks, and high-volume cargo movements.
| Category | Figures |
| Total annual passengers | 4.3 million |
| Average daily passengers | 11,800 |
| Peak daily traffic (December 27 – 28) | 30,000 |
| Busiest month | August |
| Annual cargo flights | 4,000+ |
| Monthly cargo volume | 1,100+ semi-trucks |
| Infrastructure investment since 1997 | $1 billion+ |
| Runway rehabilitation | 2019 (Runway 13/31) |
| Runway lifespan after rehabilitation | 12 to 15 years |
Regional Analysis of Passenger Traffic Across Canadian Airports
Data from Statistics Canada reveals insights into passenger traffic in airports across Canada.
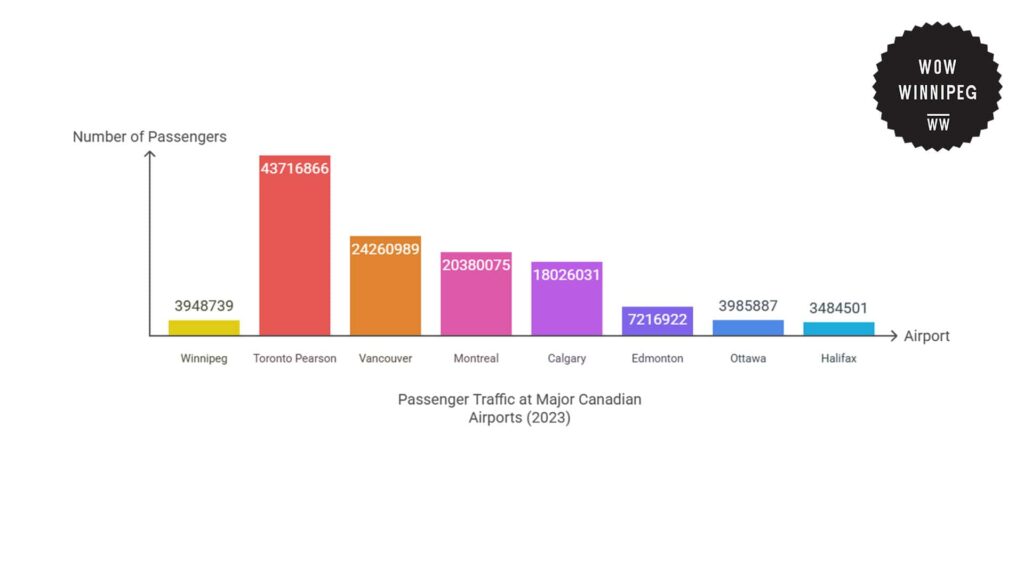
The Winnipeg Richardson International Airport had 3,948,739 passengers in 2023. Although this is up from 2,956,990 passengers in 2022, it is still below some of Canada’s other airports.
For example, the Toronto Pearson International Airport received 43,716,866 passengers, which is 39,768,127 more than that of the Winnipeg airport.
As Canada’s main international gateway, the passenger traffic in the Toronto Pearson Airport far exceeds any of the others in the country.
Likewise, the Vancouver International Airport received 24,260,989 passengers, which is 20,312,250 more than Winnipeg. This shows that this airport is another primary destination for passengers in Canada.
Meanwhile, the Montreal-Pierre Elliott Trudeau International Airport handled 20,380,075 passengers. This number is 16,431,336 passengers more than Winnipeg.
Another major airport in Western Canada, the Calgary International Airport, received 18,026,031 passengers during the same period. This also exceeds Winnipeg’s number by 14,077,292.
Similarly, the Edmonton International Airport saw 7,216,922 passengers, which is 3,268,183 more than that of the Winnipeg Airport.
Among smaller airports, the Ottawa Macdonald-Cartier International Airport received 3,985,887 passengers. This is closer to Winnipeg’s number but still exceeds it by 37,148.
The only airport that received fewer passengers than the Winnipeg Airport is the Halifax Stanfield International Airport. They received a total of 3,484,501 passengers, which is 464,238 below Winnipeg’s figure.
These statistics all show that the Winnipeg Airport is among Canada’s smaller airports, as it handles much fewer passengers annually.
| Total passengers enplaned and deplaned | |||||
| Geography | 2019 | 2020 | 2021 | 2022 | 2023 |
| Canada | 162,864,077 | 46,349,535 | 46,280,911 | 118,882,897 | 150,705,583 |
| Halifax/Robert L Stanfield International, Nova Scotia | 4,128,803 | 975,018 | 1,049,286 | 3,066,979 | 3,484,501 |
| Montréal/Pierre Elliott Trudeau International, Quebec | 19,578,357 | 5,178,197 | 5,008,101 | 15,511,340 | 20,380,075 |
| Ottawa/Macdonald-Cartier International, Ontario | 4,971,789 | 1,339,541 | 1,123,336 | 2,931,659 | 3,985,887 |
| Toronto/Lester B Pearson International, Ontario | 49,187,804 | 12,996,101 | 12,367,942 | 35,028,484 | 43,716,866 |
| Winnipeg/James Armstrong Richardson International, Manitoba | 4,395,426 | 1,235,260 | 1,163,453 | 2,956,990 | 3,948,739 |
| Calgary International, Alberta | 17,203,118 | 5,321,886 | 5,897,116 | 14,055,697 | 18,026,031 |
| Edmonton International, Alberta | 7,892,679 | 2,461,545 | 2,588,521 | 5,696,538 | 7,216,992 |
| Vancouver International, British Columbia | 25,738,851 | 7,199,495 | 7,000,547 | 18,613,367 | 24,260,989 |
Airport Traffic Trends at the Winnipeg Airport
According to Statistics Canada, the Winnipeg Richardson International Airport has seen passenger volumes fluctuate over the past years.
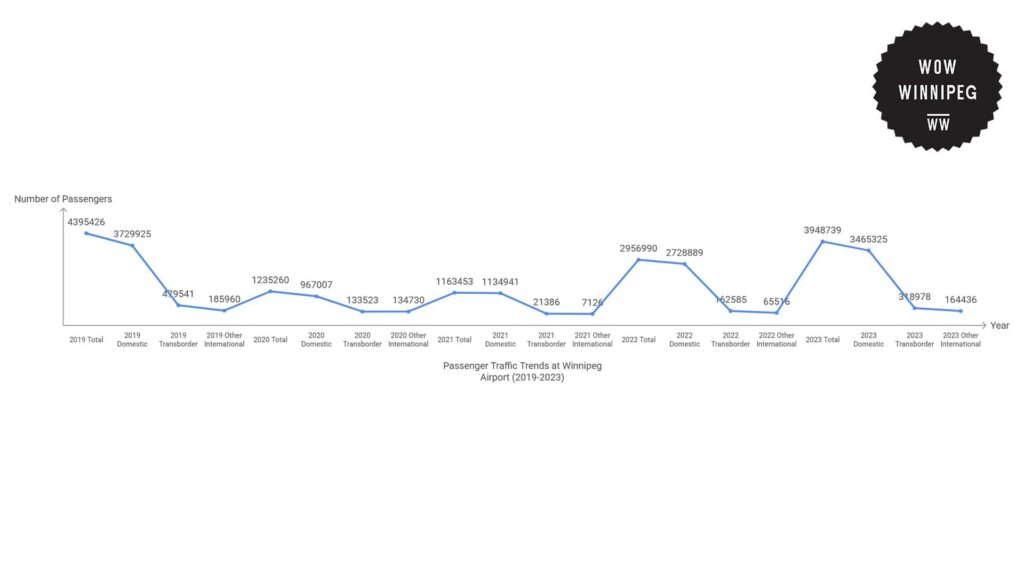
In 2019, the YWG hosted a total of 4,395,426 passengers. Most of these were domestic, at 3,729,925 passengers.
During the same year, the transborder division, which serves flights to the United States, had 479,541 passengers. Other international flights carried another 185,960 passengers.
The number of passengers decreased drastically in 2020 following the COVID-19 pandemic. Passenger traffic was at 1,235,260, which is a decrease of 3,160,166 from 2019.
Domestic travel was hit the hardest, as it decreased by 2,762,918 passengers. Transborder traffic also decreased by 346,018 passengers, and other international flights dropped by 51,230 passengers.
In 2021, the total number of passengers grew minimally to 1,163,453. The transborder sector only had 21,386 passengers, while other international travel fell further to 7,126 passengers.
2022 saw a stronger increase in passenger traffic, with the total number of passengers hitting 2,956,990. This shows a growth of 1,793,537 passengers compared to 2021.
In 2023, the YWG had 3,948,739 total passengers, which was almost a million more than in 2022. Domestic traffic was still the biggest sector, growing to 3,465,325 passengers.
Meanwhile, transborder traffic continued to increase, reaching 318,978 passengers, which is 156,393 more than in the previous year. Other international travel also increased, reaching 164,436 passengers.
These numbers show that the YWG has not reached pre-pandemic passenger traffic levels yet.
| Air passenger traffic | 2019 | 2020 | 2021 | 2022 | 2023 |
| Total, passengers enplaned and deplaned | 4,395,426 | 1,235,260 | 1,163,453 | 2,956,990 | 3,948,739 |
| Domestic sector | 3,729,925 | 967,007 | 1,134,941 | 2,728,889 | 3,465,325 |
| Transborder sector | 479,541 | 133,523 | 21,386 | 162,585 | 318,978 |
| Other International sector | 185,960 | 134,730 | 7,126 | 65,516 | 164,436 |
Costs and Consequences of Fluctuating Passenger Traffic
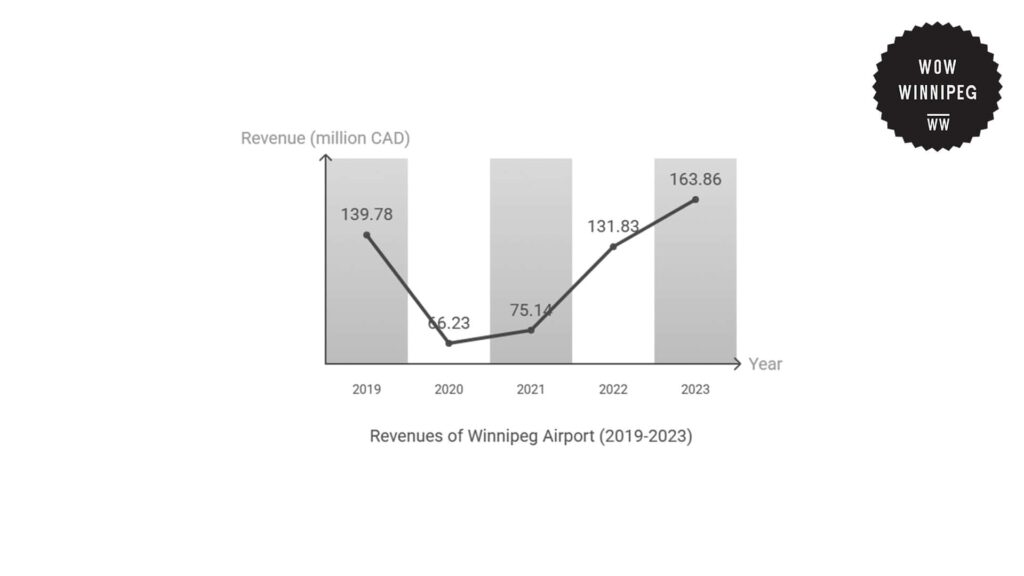
The Winnipeg Airport’s Financial Report for 2023 shows that YWG saw financial instability between 2019 and 2023, likely due to the effects of the COVID-19 pandemic and the recovery in airport activity.
In 2020, when passenger traffic dropped to an all-time low of 1,235,260, revenue also declined to $66.23 million, which is a decrease of $73.55 million from 2019.
Operating expenses were cut to $50.25 million, though the reduction was not enough to cover losses. The YWG still incurred a net loss of $40.30 million, which highlights the heavy financial burden caused by fluctuating passenger traffic levels.
Despite a slight increase in air travel in 2021, the airport’s revenue remained low at $75.14 million. Operating costs continued to fall to $46.91 million, which shows attempts to cut down on expenses.
However, even with these cuts, the airport still experienced a net loss of $34.21 million. This continues to illustrate the heavy financial cost of low passenger traffic.
As passenger traffic began to increase again in 2022, revenue increased to $131.83 million, nearly doubling from the previous year.
However, higher operational demands led to a $17.71 million increase in operating expenses, which rose to $64.62 million. The airport still reported a net loss of $5.46 million.
In 2023, the airport reported a revenue of $163.86 million, which was the highest it’s seen in five years.
With this increase, operating costs rose to $75.34 million, due to additional resources needed to accommodate increased traffic volumes. Despite this, the airport recorded a net income of $14.86 million.
These trends show how the YWG’s financial health is reliant on steady passenger traffic. Sudden declines in passenger traffic can also cause abrupt changes to the airport’s financial plans, which further affect its revenues.
| Category(in thousands of Canadian dollars) | 2019 | 2020 | 2021 | 2022 | 2023 |
| Revenue | 139,781 | 66,232 | 75,139 | 131,833 | 163,862 |
| Operating expenses | 62,983 | 50,250 | 46,909 | 64,618 | 75,342 |
| Ground lease rent | 9,730 | 535 | – | 8,773 | 12,752 |
| Earnings before interest, income taxes & depreciation | 67,068 | 15,447 | 28,230 | 58,442 | 75,768 |
| Depreciation | 30,503 | 32,784 | 35,179 | 35,296 | 35,712 |
| Earnings | 36,565 | 17,337 | 6,949 | 23,146 | 40,056 |
| Net Income (Loss) | 3,449 | 40,296 | 34,211 | 5,458 | 14,855 |
| Capital expenditures | 56,981 | 10,620 | 8,503 | 26,420 | 32,946 |
Interventions and Initiatives by the Winnipeg Airport
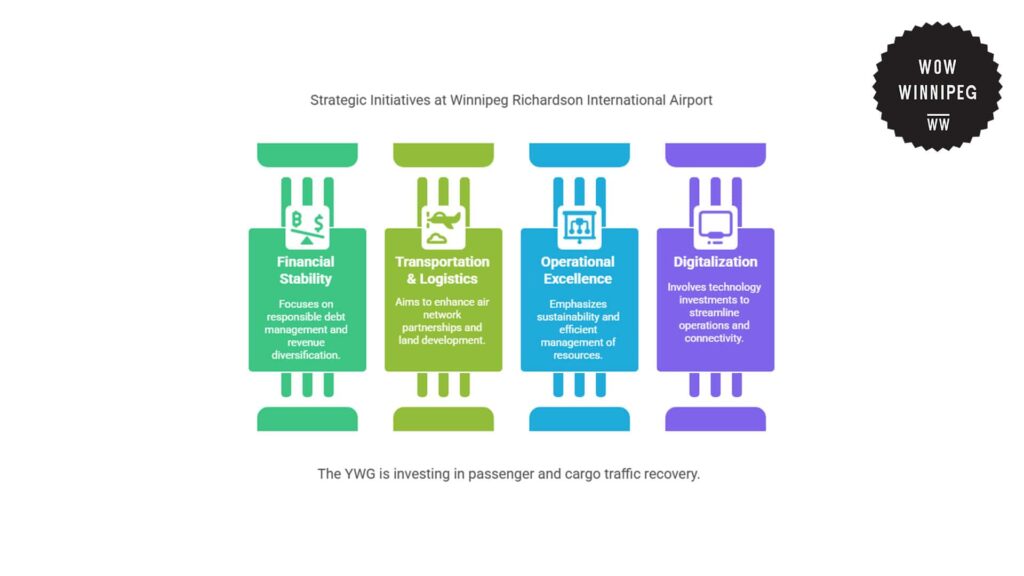
The Winnipeg Richardson International Airport has implemented a five-year strategic plan to address financial stability, improve air transportation and logistics services, enhance operational efficiency, and advance digitalization.
To ensure long-term financial sustainability, the airport is focusing on responsible debt management, securing external funding, and diversifying revenue streams to support infrastructure investments and maintain service quality.
In air transportation and logistics, the YWG is investing in passenger and cargo traffic recovery, expanding air network partnerships, and promoting land development to strengthen its role as a logistics hub while supporting economic growth.
Operational excellence is also a key priority for them, with a focus on sustainability, asset management, and enhancing the YWG’s ability to manage fluctuations in passenger and cargo volumes through a stronger framework that ensures efficiency.
Meanwhile, digitalization efforts are also underway, with investments in technology aimed at streamlining operations, improving efficiencies across different airport functions, and enhancing digital connectivity for travelers.
These initiatives position YWG for long-term growth while improving airport infrastructure, service quality, and operational resilience to meet evolving industry demands.
The Future of the Winnipeg Airport
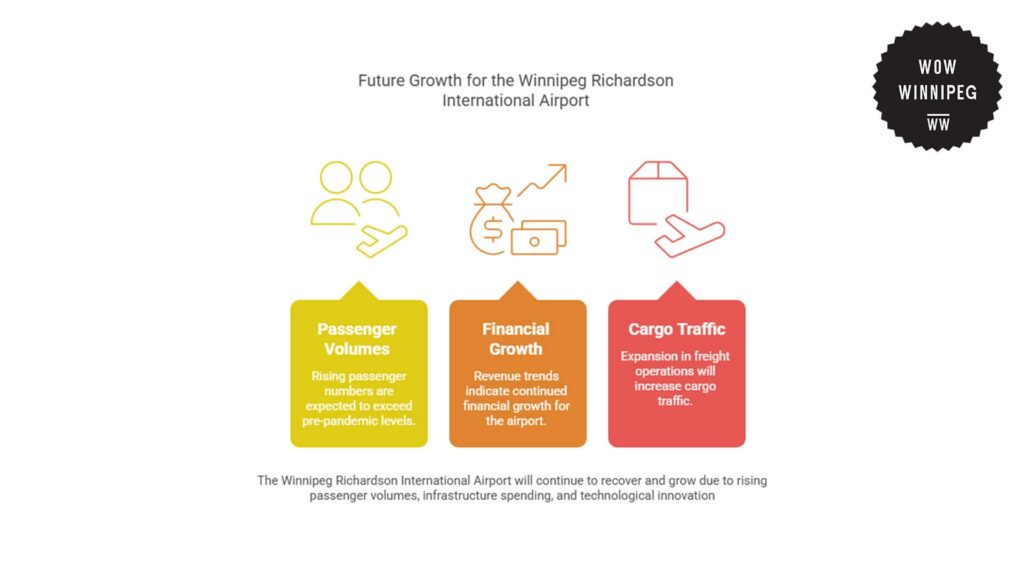
The Winnipeg Richardson International Airport will continue to recover and grow, fueled by rising passenger volumes, infrastructure spending, and technological innovation.
With 3,948,739 passengers in 2023, these figures are set to exceed pre-pandemic levels in the next few years.
Financially, current revenue trends indicate continued growth for the airport, following the peak of $163.86 million recorded in 2023.
Cargo traffic is also expected to increase with further expansions in freight operations, especially with the YWG establishing itself as a key logistic hub.
Overall, all of these trends imply that the YWG will continue to experience gradual growth in passengers, financial outcomes, and infrastructure investment, making it a leading airport in the country.
References
- Winnipeg Richardson International Airport. (n.d.). Fast facts. Retrieved from https://www.ywg.ca/en/newsroom/fast-facts/
- Statistics Canada. (n.d.). Table 23-10-0253-01: Air passenger traffic at Canadian airports, annual. Retrieved from https://www150.statcan.gc.ca/t1/tbl1/en/tv.action?pid=2310025301
- Canadian Broadcasting Corporation. (2024, January 18). Winnipeg airport sees increase in passengers, but still below pre-pandemic levels. Retrieved from https://www.cbc.ca/news/canada/manitoba/winnipeg-airport-pssengers-1.7106412
- Winnipeg Richardson International Airport. (2023). 2023 financial report. Retrieved from https://www.ywg.ca/assets/pages/2023_Financial_Report-FINAL.pdf
- Winnipeg Richardson International Airport. (n.d.). About us. Retrieved from https://www.ywg.ca/en/corporate/about-us/
- Winnipeg Richardson International Airport. (n.d.). Reports & publications. Retrieved from https://www.ywg.ca/en/corporate/about-us/reports-publications/
- Winnipeg Richardson International Airport. (2023). 2023 annual report. Retrieved from https://www.ywg.ca/assets/pages/2023-Annual-Report-FINAL-2.pdf
- Winnipeg Richardson International Airport. (2024). Passenger statistics Q3 2024. Retrieved from https://www.ywg.ca/assets/pages/Passenger_Statistics_Q3_EN_2024.pdf
- Winnipeg Richardson International Airport. (2020). YWG economic impact report. Retrieved from https://www.ywg.ca/assets/pages/2020_YWG_Economic_Impact_Report.pdf