Car Statistics in Winnipeg: Traffic Trends and Road Safety

Key Insights
| The Government of Winnipeg’s Transportation Master Plan 2050 indicates that the city’s 8,300 km road network handles an estimated 1,686,500 vehicle kilometers annually during peak hours. Data from Statistics Canada shows that individuals aged 65 and older had the highest number of traffic-related fatalities, with 435 deaths recorded. According to Manitoba Public Insurance’s Traffic Collision Statistics Report, Winnipeg accounted for 59.1% of Manitoba’s total traffic collisions in 2022, with 33,510 reported incidents. Statistics Canada illustrates that only 13.6% of Winnipeg commuters used public transit in 2016. Another report by Statistics Canada reveals that the cost of traffic accidents in Canada was $35.98 billion in 2010. |
The Government of Winnipeg’s Transportation Master Plan 2050 gives insights into car statistics in the city.
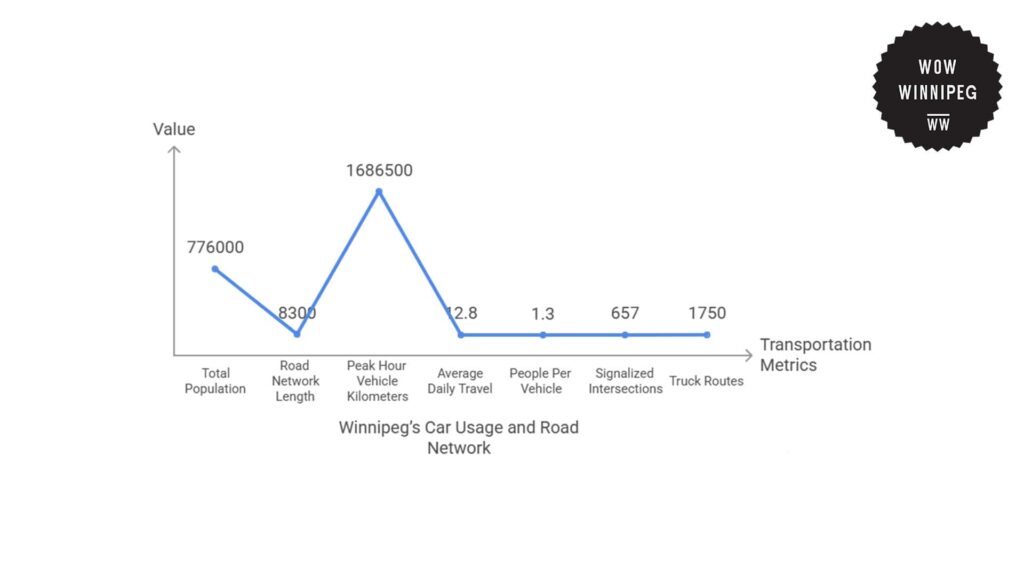
Winnipeg’s road system transports an increasing number of 776,000 residents, with private vehicles dominating daily travel.
The city’s 8,300 km of roads carry a heavy traffic load, with an estimated 1,686,500 vehicle kilometers traveled per year during peak hours.
This rate of road use shows a high dependence on automobiles for commuting, shopping, and other trips in the daily lives of residents in the city.
On average, Winnipeggers travel 12.8 km daily in personal vehicles, and most vehicles have 1.3 people per trip.
These numbers show that most private vehicles transport just 1 person at a time, which may also be a cause of heavy traffic and high road congestion.
Although there are 657 signalized intersections in the city that control traffic flow, vehicle dependency at high levels can result in bottlenecks and longer travel times for commuting residents.
Along with private car usage, Winnipeg’s transportation system also facilitates commercial traffic.
Winnipeg has 1,750 km of dedicated truck routes that allow for the transportation of goods with more efficiency.
This dedicated system also directs freight transport away from general traffic in strategic locations, which aims to minimize the risk of interference between vehicles.
| Statistics | Value |
| Total population of residents transported in Winnipeg’s road system | 776,000 |
| Total road network length | 8,300 km |
| Total vehicle kilometers traveled annually during peak hours | 1,686,500 vehicle kilometers |
| Average daily personal vehicle travel | 12.8 km per person |
| Average number of people per vehicle | 1.3 |
| Number of signalized intersections | 657 |
| Designated truck routes | 1.750 km |
Regional Analysis of Car Usage Across Canada
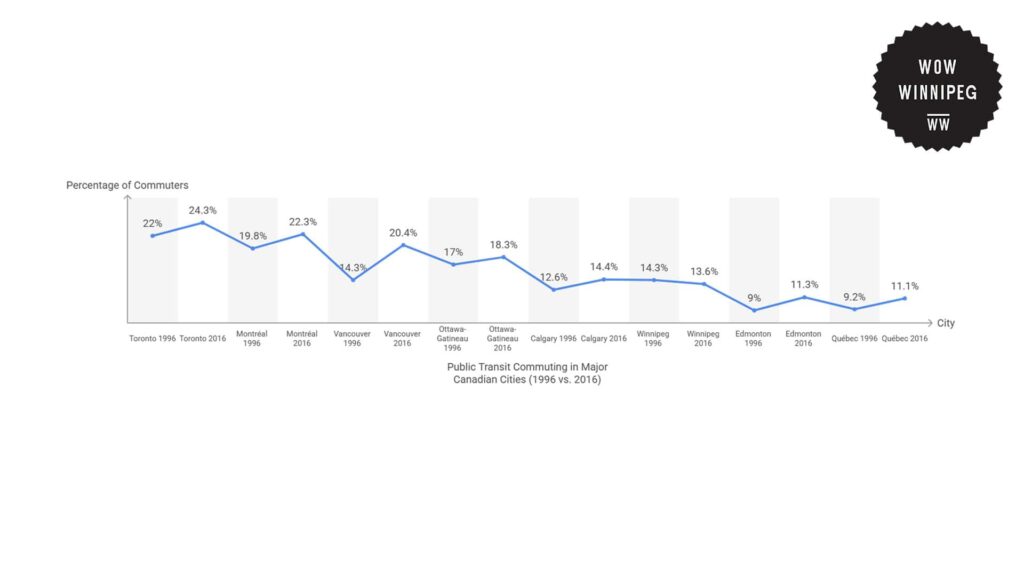
Data from Statistics Canada reveals trends in commuting and car usage across different provinces in Canada.
In 2016, just 13.6% of Winnipeg commuters used public transit, which is a 0.7-point decrease compared to the 14.3% rate in 1996.
When compared to other cities, Toronto has the highest rate of residents traveling by transit, at 24.3% in 2016. This is also an increase of 2.3 percentage points from 1996.
Meanwhile, Vancouver recorded the highest growth as it increased by 6.1 percentage points from 14.3% to 20.4%.
Other cities also experienced some increases. Ottawa-Gatineau moved from 17.0% to 18.3%, which is a gain of 1.3 percentage points, while Calgary went up from 12.6% to 14.4%, or a 1.8 percentage point rise.
Similarly, Edmonton’s rate also grew from 9.0% to 11.3%, which is an increase of 2.3 percentage points, and Québec grew from 9.2% to 11.1%, or a 1.9 percentage point increase.
These trends show that Winnipeg’s slight decrease in public transit use actually diverges from the overall trend toward rising transit ridership throughout Canada.
| City | 2016 % | 1996 % | Change Percentage Points |
| Toronto | 24 | 22 | 2.3 |
| Montréal | 22.3 | 19.8 | 2.5 |
| Vancouver | 20.4 | 14.3 | 6.1 |
| Ottawa-Gatineau | 18.3 | 17 | 1.3 |
| Calgary | 14.4 | 12.6 | 1.8 |
| Winnipeg | 13.6 | 14.3 | -0.7 |
| Edmonton | 11.3 | 9 | 2.3 |
| Québec | 11.1 | 9.2 | 1.9 |
Vehicle Accident Trends in Winnipeg
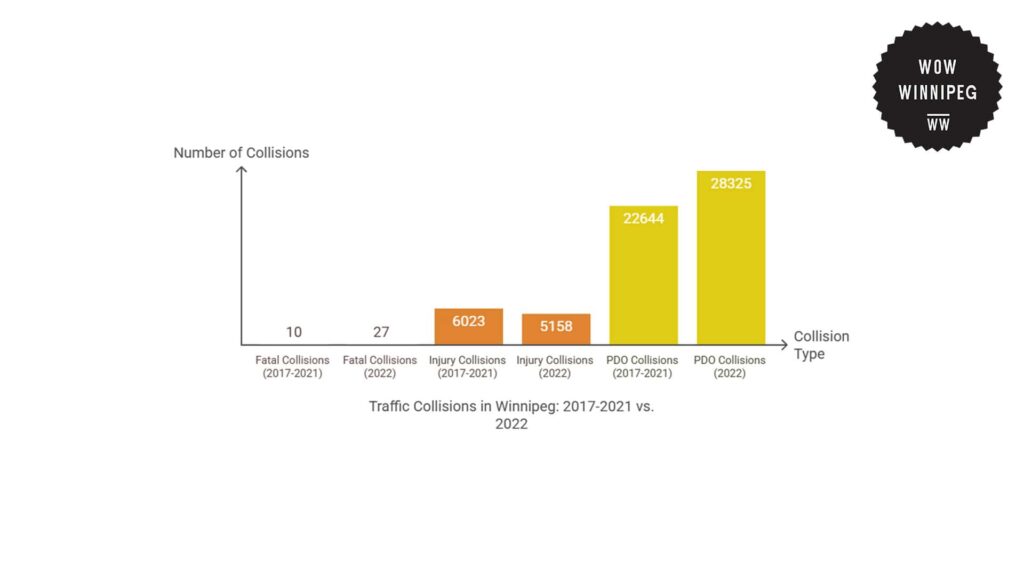
Data from Manitoba Public Insurance’s Traffic Collisions Statistics Report reveals concerning figures about vehicle accidents in Winnipeg.
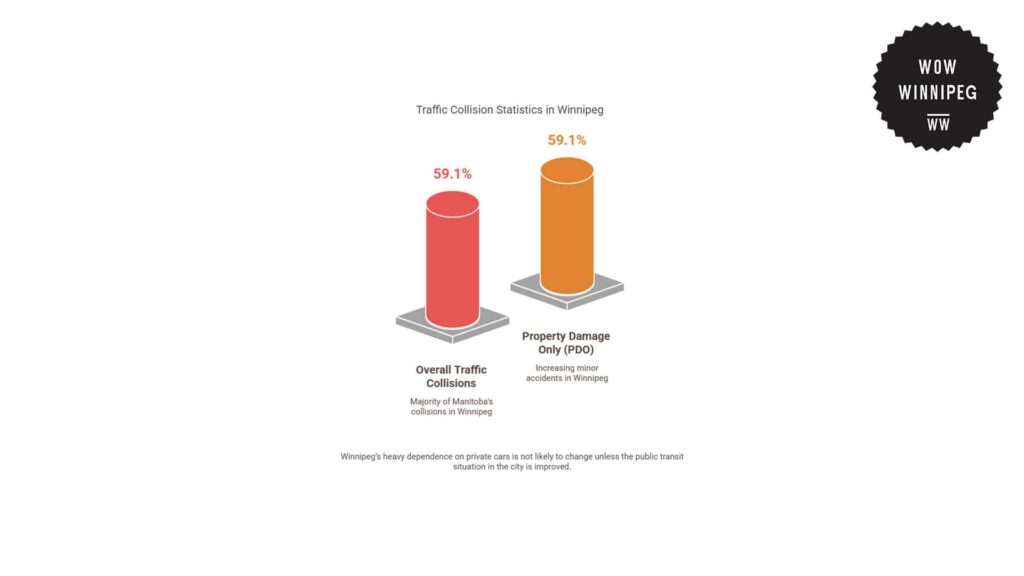
Winnipeg was responsible for 59.1% of Manitoba’s total traffic accidents in 2022, with 33,510 incidents. This is higher than the previous 2017-2021 average of 28,677 accidents, which comprised 57.8% of the province’s total.
Moreover, deadly crashes in the city also increased sharply. Winnipeg had 27 deadly crashes in 2022, which accounted for 30.0% of Manitoba’s total deadly crashes.
This is almost three times more than the previous average of 10 deadly crashes per year from 2017-2021.
Meanwhile, the rate of collisions involving injury decreased but still remains significant. There were 5,158 injury crashes in 2022, which is 74.2% of all injury-related collisions in the province.
This rate is below the 2017-2021 average of 6,023 injury crashes, which could show that stricter traffic enforcement rules have been minimizing this number.
Notably, property damage-only (PDO) accidents showed the biggest number of instances, at 28,325 in 2022. This accounts for 57.0% of Manitoba’s total PDO accidents.
This number is also much larger than the average of 22,644 PDO accidents from 2017 to 2021, which shows a significant increase in non-injury crashes.
The trends show that Winnipeg continues to register a large number of traffic accidents.
| Collision Type | 2022 Count | % of Manitoba Total (2022) | 2017-2021 Average | % of Manitoba Total (2017-2021) |
| Fatal Collisions | 27 | 30.00% | 10 | NA |
| Injury Collisions | 5,158 | 74.20% | 6,023 | NA |
| Property Damage Only (PDO) | 28,325 | 57.00% | 22,644 | NA |
| Total Collisions | 33,510 | 59.10% | 28,677 | 57.80% |
Vehicle Accidents by Age Group
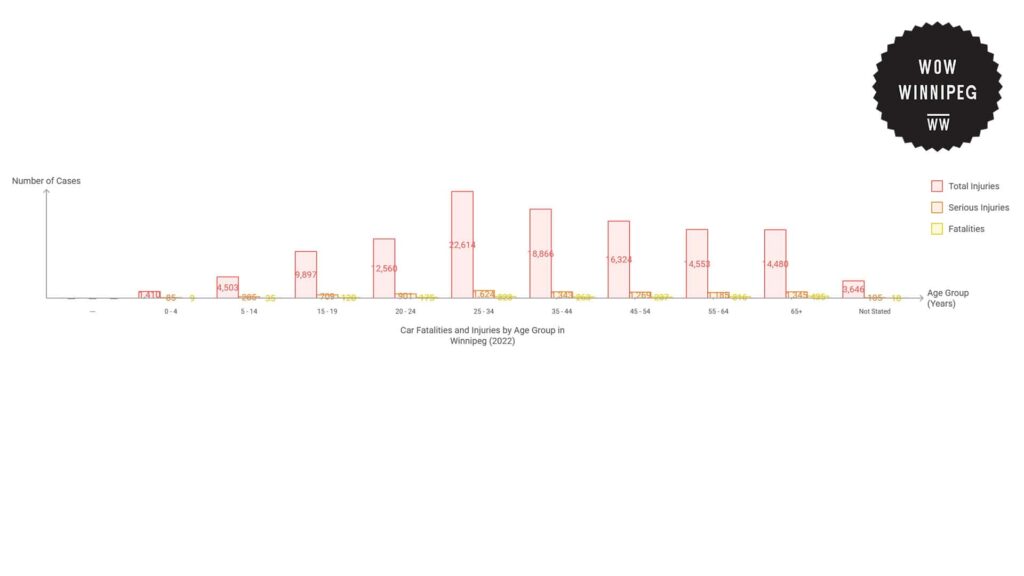
Statistics Canada shows disparities in vehicle accidents when looking at age demographics.
The greatest number of deaths were among people 65 years and older, at 435 instances. This illustrates how older populations are the most vulnerable age group.
Meanwhile, the next highest number of deaths was among people aged 25 to 34, with 323 incidents. This is followed by the group aged 55 to 64, with 316 deaths.
These figures show that middle-aged and older adult drivers are among the most susceptible to fatal crashes. This is possibly due to factors such as slower reaction times or greater injury severity among older drivers.
However, severe injuries were most prevalent among 25 to 34-year-olds, with 1,624 incidents. This is followed by the group for 35 to 44-year-olds, with 1,343 severe injuries.
Notably, the 25 to 34 age group also suffered the highest number of injuries at 22,614. This number is followed by 35 to 44-year-olds with 18,866 injuries and 20 to 24-year-olds with 12,560 injuries.
Although younger age groups had high injury rates, their fatality numbers were lower compared to older age groups, indicating a higher survival rate despite a higher number of collisions.
Similarly, children aged less than 15 years old had fewer deaths and injuries. The age group of 0 to 4 years old had 9 deaths and 1,410 total injuries, while the 5 to 14-year-old age group had 35 deaths and 4,503 total injuries.
These statistics show that although young children are not often involved in fatal crashes, they are still at risk as passengers or pedestrians.
Overall, these numbers reveal a trend of the elderly population having the highest death rates, and young adults suffering the most from injuries.
| Age Group (Years) | Fatalities | Serious Injuries | Total Injuries |
| 0 – 4 | 9 | 85 | 1,410 |
| 5 – 14 | 35 | 285 | 4,503 |
| 15 – 19 | 120 | 709 | 9,897 |
| 20 – 24 | 175 | 901 | 12,560 |
| 25 – 34 | 323 | 1,624 | 22,614 |
| 35 – 44 | 263 | 1,343 | 18,866 |
| 45 – 54 | 237 | 1,269 | 16,324 |
| 55 – 64 | 316 | 1,185 | 14,553 |
| 65+ | 435 | 1,345 | 14,480 |
| Not Stated | 18 | 105 | 3,646 |
| Total | 1,931 | 8,851 | 118,853 |
Costs and Consequences of Car Accidents in Canada
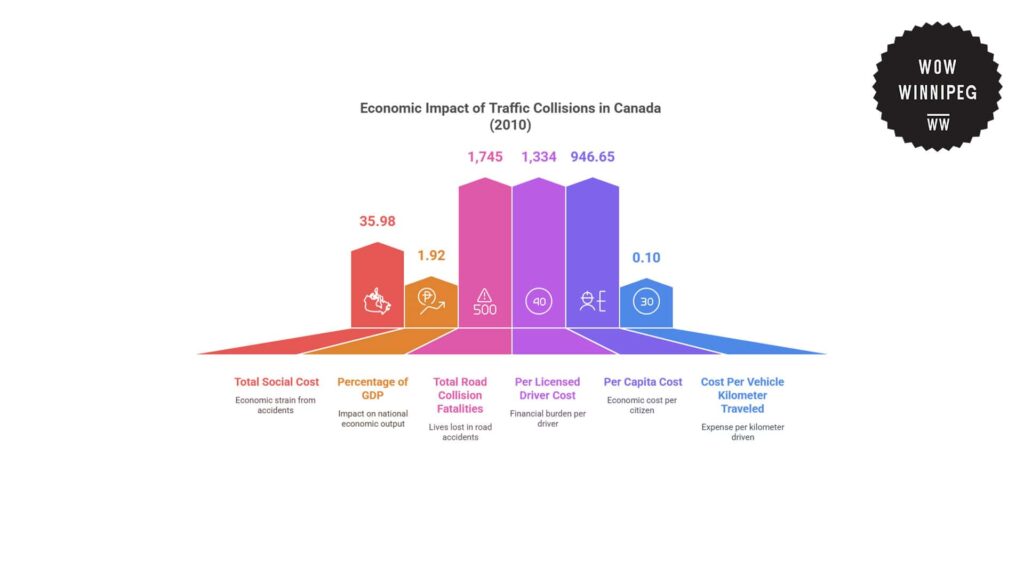
Another report by Statistics Canada shows that traffic accidents place a huge economic strain on the country’s economy.
In 2010, the social cost of accidents in Canada was placed at $35.98 billion. This includes the economic effect of fatalities, injuries, and property loss.
This value makes up 1.92% of the nation’s gross domestic product (GDP), which highlights the high cost of financial losses in road accidents for the country.
During this period, Canada recorded 1,745 fatalities due to road collisions.
With a total population of 38 million citizens and 26.97 million licensed operators, this accounts for a cost per capita of $946.65 and a per licensed driver cost of $1,334. These costs come from medical expenditures, insurance fees, and lost productivity.
These statistics show how each citizen, regardless of whether or not they have a license, shares in the economic burdens caused by these accidents.
Moreover, the economic cost of crashes extends beyond the direct costs of medical care and vehicle damage. There is also the immediate cost of loss of life, which affects families and communities on a more personal level.
| Statistic | Value |
| Total Social Cost of Collisions | $35.98 billion |
| Percentage of GDP | 1.92% |
| Total Road Collision Fatalities | 1,745 |
| Per Licensed Driver Cost | 1,334 |
| Per Capita Cost | $946.65 |
| Total Licensed Drivers | 26,971,220 |
| Total Population | 38,007,166 |
| Total Vehicle Kilometers Traveled (VKT) | 372,499 million |
| Cost Per Vehicle Kilometer Traveled | $0.10 |
Interventions and Solutions to Car Accidents in Winnipeg
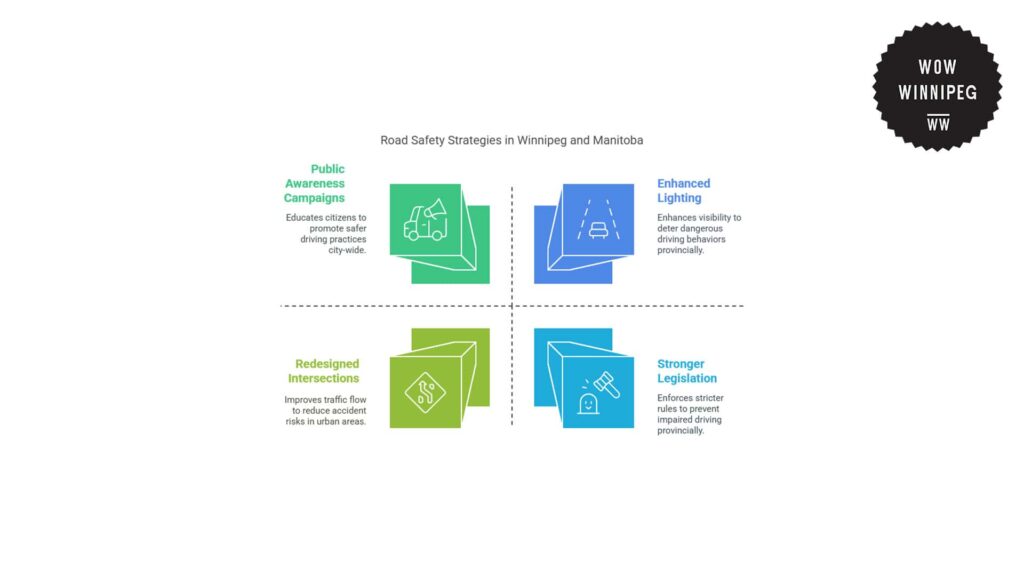
Winnipeg’s Road Safety Strategic Action Plan 2022 identifies the main strategies to minimize traffic-related injuries and fatalities in the city.
The plan prioritizes evidence-based decision-making through the examination of collision patterns to determine which locations in the city are at the most risk for accidents.
These initiatives include engineering upgrades like enhanced pedestrian crossings, better signage, and redesigned intersections around Winnipeg.
Meanwhile, education and awareness efforts also seek to encourage safer driving and pedestrian behavior. This includes conducting public awareness campaigns to promote safe driving, walking, and cycling practices.
Similarly, increased enforcement and stricter traffic rules hope to focus on dangerous behaviors such as speeding and driving under the influence.
At the provincial level, the Government of Manitoba has also implemented various programs for improving road safety.
Some of these include better signage, renewed pavement markings, and enhanced lighting to lower the chances of collisions.
Moreover, the government has also implemented stronger legislation against impaired driving, to deter dangerous behavior.
Aligned with all of this, their initiative, “The Road to Zero: Manitoba Road Safety Plan 2017 to 2020” introduces a Safe System approach for achieving safer roads in the entire province.
This plan emphasizes safer roads by designing infrastructure that minimizes driving mistakes and protects vulnerable users. This includes more appropriate speed limits and smoother traffic management.
Additionally, the plan also prioritizes the use of safe vehicles that are properly designed and manufactured for maximum safety.
Future Trends in Car Statistics for Winnipeg
Winnipeg’s traffic conditions and road safety are likely to change based on existing trends in vehicle dependency, collision frequency, and investment in infrastructure.
Given that 59.1% of Manitoba’s overall traffic collisions occur in Winnipeg, small accidents and congestion may keep increasing, particularly as property damage-only (PDO) collisions continue to grow.
Current initiatives and strategies in Winnipeg and Manitoba may lower fatalities and injuries through improving enforcement, infrastructure improvement, and raising public awareness.
However, Winnipeg’s heavy dependence on private cars is not likely to change unless the public transit situation in the city is improved.
Without significant investments in public transportation, Winnipeg’s roads will remain congested, which also further increases the risk of collisions and accidents.
References
- City of Winnipeg. (n.d.). Transportation master plan summary (Draft v4). Retrieved from https://ehq-production-canada.s3.ca-central-1.amazonaws.com/4888f7c226af3d49dd00ef6cef205994fe39ec1f/original/1630076294/5eafdd729d152e0970a35b0a6b640b50_PW_TMP-Summary_DRAFT-v4_ENG.pdf
- Statistics Canada. (2017, November 29). Journey to work: Key results from the 2016 census. Government of Canada. Retrieved from https://www150.statcan.gc.ca/n1/daily-quotidien/171129/dq171129c-eng.htm?indid=14433-4&indgeo=7
- Manitoba Public Insurance. (2022). Traffic collision statistics report 2022. Retrieved from https://www.mpi.mb.ca/wp-content/uploads/TCSR2022.pdf
- Transport Canada. (2022). Canadian motor vehicle traffic collision statistics 2022. Government of Canada. Retrieved from https://tc.canada.ca/en/road-transportation/statistics-data/canadian-motor-vehicle-traffic-collision-statistics-2022
- Transport Canada. (2020). Statistics on the social costs of collisions in Canada 2020. Government of Canada. Retrieved from https://tc.canada.ca/en/road-transportation/statistics-data/statistics-social-costs-collisions-canada-2020
- City of Winnipeg. (2022). Winnipeg road safety strategic action plan. Retrieved from https://ehq-production-canada.s3.ca-central-1.amazonaws.com/5e98200b4b3ac235f4437bff3cab6add6ecc2514/original/1658930229/dac8de3501ba784239b87a181a5a6ae9_Winnipeg_Road_Safety_Strategic_Action_Plan.pdf
- Government of Manitoba. (2018). Province announces new road safety initiatives. Retrieved from https://news.gov.mb.ca/news/index.html?item=42237