Immigration in Winnipeg by the Numbers: Statistics and Trends

Key Insights
| Data from the Manitoba Immigration Facts Report 2021 reveals that over 72,935 permanent residents moved to Manitoba from 2017 to 2021. The same report shows that there was the Provincial Nominee Program had the highest number of immigrants, at 47,020 individuals or 64.5% of the newcomer population. Statista reports that Manitoba received 21,300 international immigrants in 2023. However, by Q3 2024, the province also had a net interprovincial migration loss of 1,200 people. According to data from Statistics Canada, there were 207,950 immigrants in the Winnipeg Census Metropolitan Area in 2021. The National Housing Strategy targets vulnerable populations like immigrants and hopes to reduce homelessness by 50%. |
The Manitoba Immigration Facts Report 2021 shows that between 2017 and 2021, the province had a growth in migration trends, receiving a total of 72,935 permanent residents during this period.
In 2017, there were 14,705 new arrivals. This then rose to 15,225 in 2018 and peaked at 18,910 in 2019.
This was a total 28.5% rise in three years. The numbers then dropped to 8,630 in 2020, which is a 54.4% decrease from the previous year and the lowest level in five years.
However, in 2021, arrivals recovered to 16,560. This number is up by 91.9% compared to the previous year.
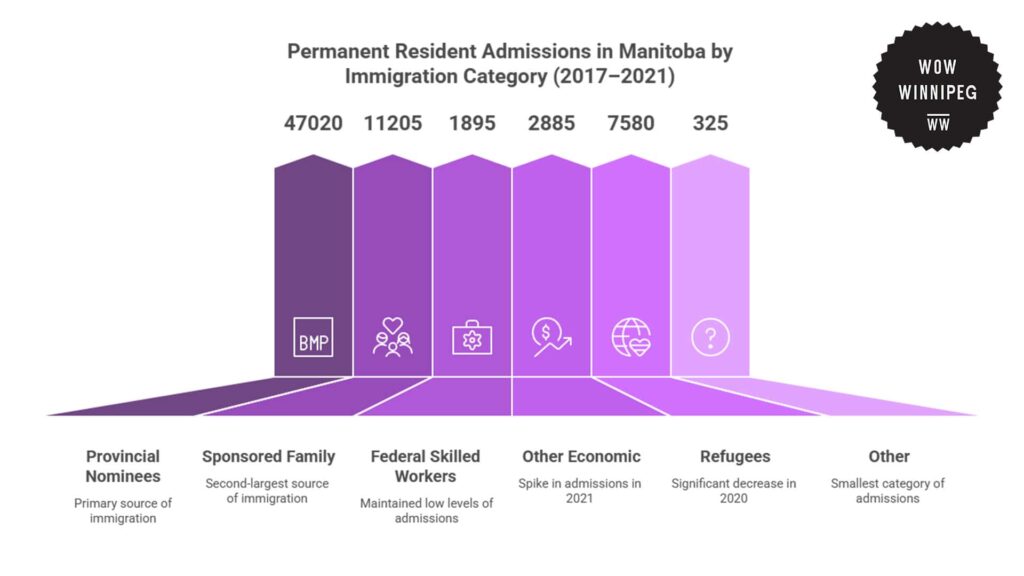
The Provincial Nominee Program was the primary source of immigration during this period, adding 47,020 people, or 64.5% of total admissions.
Sponsored Family immigration was the second-largest source, with 11,205 over five years.
Migrants from this program increased steadily from 2,475 in 2017 to 3,160 in 2019, then fell by 52.7% in 2020 to 1,495. Numbers then increased again to 2,330 in 2021.
Refugees and persons entitled to protection made up 7,580 out of the total number of immigrants.
Their numbers decreased by 70.4% between 2019 and 2020, from 2,045 to 605. In 2021, this group increased to 1,235.
Federal Skilled Worker admissions maintained fairly low levels, with a total of 1,895 overall. The category’s high in 2019 was 620, and it fell as low as 145 in 2021.
Similarly, other economic categories represented 2,885 admissions, with a spike of 1,340 in 2021.
| Immigration Category | 2017 | 2018 | 2019 | 2020 | 2021 | Total |
| Sponsored Family | 2,475 | 2,745 | 3,160 | 1,495 | 2,330 | 11,205 |
| Federal Skilled Workers | 295 | 540 | 620 | 295 | 145 | 1,895 |
| Provincial Nominees | 9,430 | 9,895 | 12,545 | 5,835 | 10,315 | 47,020 |
| Other Economic | 440 | 485 | 370 | 250 | 1,340 | 2,885 |
| Resettled Refugees & Protected Persons in Canada | 2,130 | 1,565 | 2,045 | 605 | 1,235 | 7,580 |
| Other | 30 | 30 | 50 | 35 | 180 | 325 |
| Total | 14,705 | 15,225 | 18,910 | 8,630 | 16,560 | 72,935 |
Regional Analysis of Immigration Trends Across Manitoba
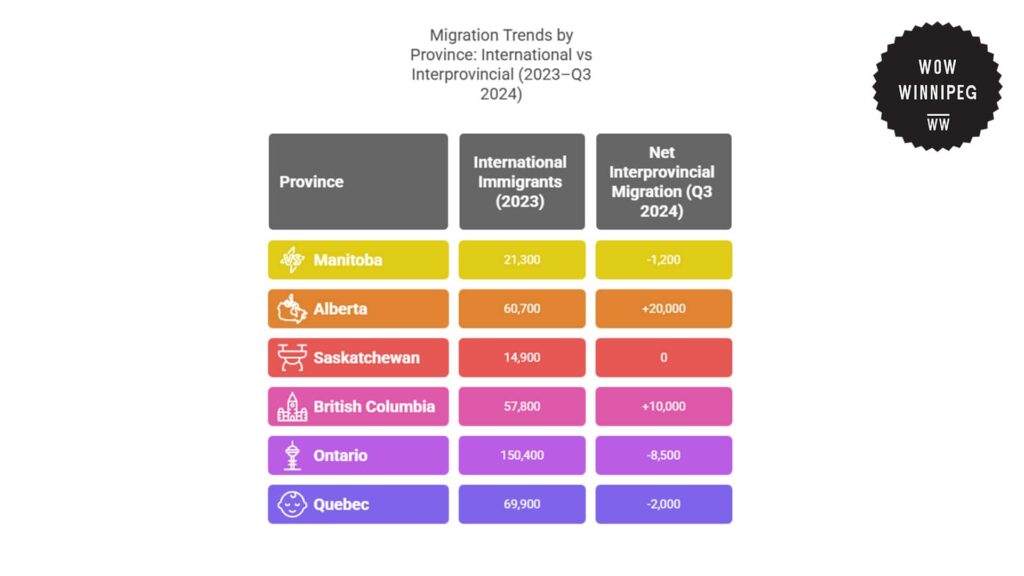
Statista reveals the number of international immigrants and net interprovincial migrants per region across Manitoba in 2023.
In 2023, Manitoba received 21,300 foreign immigrants. However, in the third quarter of 2024, the province had a net interprovincial loss of 1,200 individuals.
This means that although Manitoba is still receiving newcomers from overseas, it is also losing residents to other provinces.
Ontario had the highest number of international immigrants at 150,400. However, Ontario also had a net interprovincial loss of 8,500 individuals.
This suggests that despite high international immigration numbers, many individuals are still choosing to leave the province in favor of other areas in Canada.
Quebec had the second-highest number, with 69,900 foreign immigrants in 2023, and recorded a net loss of 2,000 citizens internally.
Meanwhile, Alberta recorded the best balance of international and interprovincial movement. Alberta received 60,700 international immigrants and a further 20,000 individuals by interprovincial migration.
This made Alberta the leading destination for Canadians moving internally, which is also a clear indication of Alberta’s strong external and internal migration attraction.
British Columbia registered similar trends at lower levels, welcoming 57,800 international immigrants and gaining 10,000 internal migrants.
Conversely, Saskatchewan had the lowest level of international immigrants at 14,900 and experienced no net change in interprovincial migration.
| Province | International Immigrants (2023) | Net Interprovincial Migration (Q3 2024) |
| Manitoba | 21,300 | -1,200 |
| Alberta | 60,700 | +20,000 |
| Saskatchewan | 14,900 | 0 |
| British Columbia | 57,800 | +10,000 |
| Ontario | 150,400 | -8,500 |
| Quebec | 69,900 | -2,000 |
Immigrant Population Trends Across Winnipeg
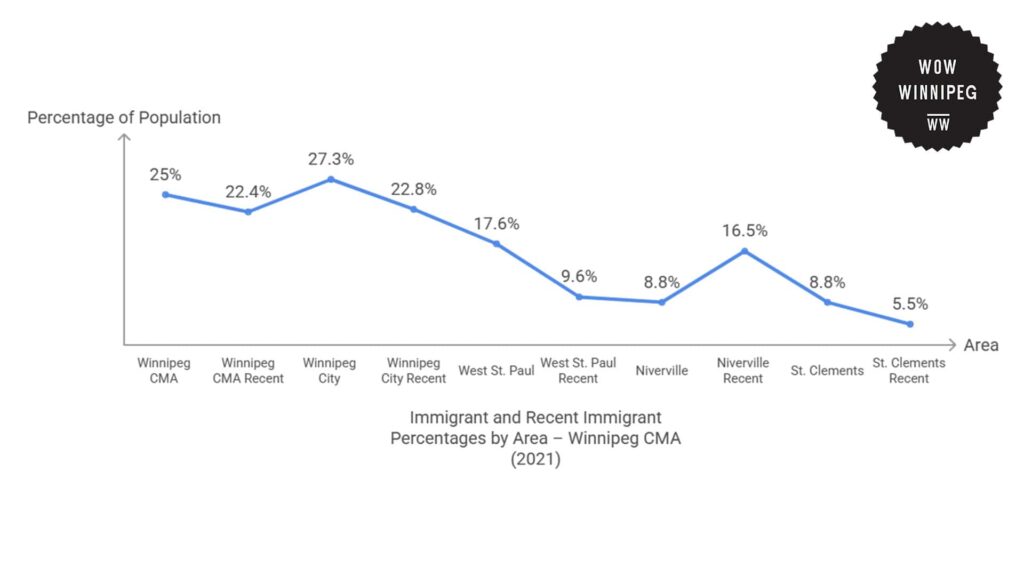
Data from Statistics Canada shows the number and distribution of immigrant populations and recent immigrants across Winnipeg.
In 2021, out of the 819,715 individuals within the Winnipeg Census Metropolitan Area, there were 207,950 immigrants. This is 25.4% of the total population.
Of these, 46,495 were recent immigrants who arrived between 2016 and 2021, accounting for 22.4% of the total immigrant population.
The City of Winnipeg received the majority of immigrants within the area. Out of the 736,660 residents, there were 201,040 immigrants or 27.3% of its population.
Moreover, the city also received 45,900 recent immigrants from 2016 to 2021, representing 22.8% of its immigrant population. This demonstrates how Winnipeg is the main destination for immigrant settlement in the area.
While smaller communities surrounding Winnipeg received a smaller number of immigrants, a few are experiencing increasing shares of recent immigrants.
West St. Paul has 1,140 immigrants, or 17.6% of its 6,485 population. Likewise, Niverville and St. Clements each reported immigrant shares of 8.8%, with Niverville reporting a higher rate of recent immigrants at 16.5%.
Some other rural municipalities reported smaller numbers. East St. Paul reported 885 immigrants (9.1%), Macdonald reported 600 (7.6%), and Rosser reported a mere 85 immigrants (7.9%).
These trends indicate that although the City of Winnipeg is still the main point of arrival for immigrants, surrounding cities, particularly West St. Paul and Niverville, are slowly increasing in diversity.
| Geography | Total Population | Immigrant Population | Recent Immigrants (2016 to 2021) | ||
| Number | Immigrant % | Number | % | ||
| Winnipeg (CMA) | 819,715 | 207,950 | 25% | 46,495 | 22.40% |
| East St. Paul (Rural municipality) | 9,725 | 885 | 9.10% | 40 | 4.50% |
| Headingley (Rural municipality) | 3,675 | 245 | 7% | 30 | 12.20% |
| Macdonald (Rural municipality) | 7,905 | 600 | 7.60% | 50 | 8.30% |
| Niverville (Town) | 5,865 | 515 | 8.80% | 85 | 16.50% |
| Ritchot (Rural municipality) | 7,455 | 495 | 7% | 75 | 15.20% |
| Rosser (Rural municipality) | 1,070 | 85 | 7.90% | 20 | 22.20% |
| Springfield (Rural municipality) | 15,750 | 930 | 5.90% | 60 | 6.50% |
| St. Clements (Rural municipality) | 11,405 | 1,000 | 8.80% | 55 | 5.50% |
| St. François Xavier (Rural municipality) | 1,395 | 75 | 5.40% | 10 | 13.30% |
| Taché (Rural municipality) | 11,885 | 940 | 7.90% | 60 | 6.40% |
| West St. Paul (Rural municipality) | 6,485 | 1,140 | 17.60% | 110 | 9.60% |
| Winnipeg (City) | 736,660 | 201,040 | 27.30% | 45,900 | 22.80% |
Costs and Consequences of Immigration in Winnipeg
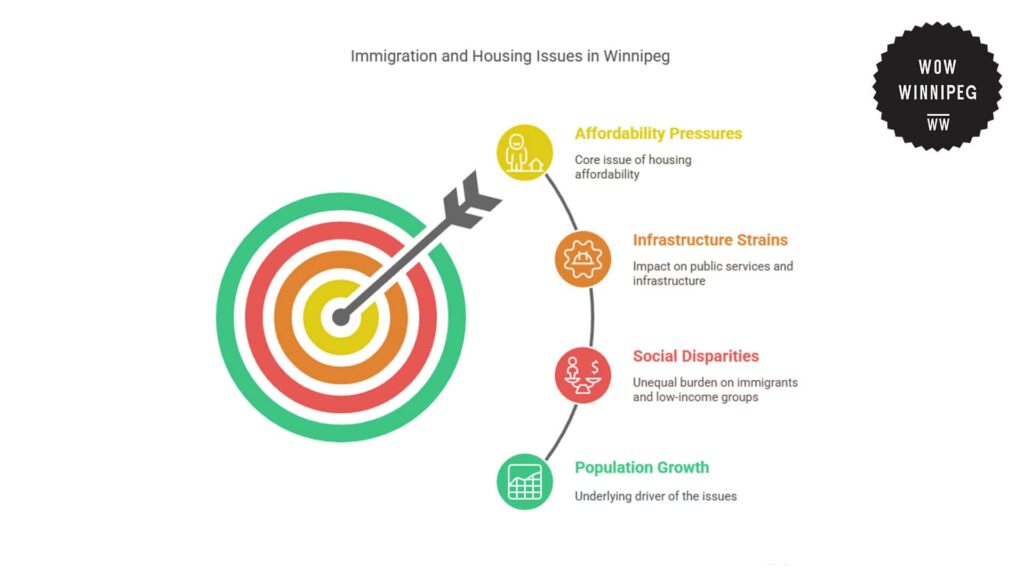
CBC News shows how the government’s rising immigration targets could make housing more expensive and put additional strains on public services.
The Immigration, Refugees and Citizenship Canada (IRCC) expects that housing construction will not be able to keep up with the pace of population growth in the country.
They warned that persistent high numbers of permanent and temporary immigrants, without corresponding investment in infrastructure, would tend to “exacerbate affordability pressures” in those cities facing housing shortages.
These predictions were made alongside the fact that Canada’s population grew by over 430,000 during Q3 2023, which is the fastest pace of population growth for the country in any quarter since 1957.
The reports also expressed fear over ripple effects in areas other than housing. Lacking increased funding and coordination, critical services like education, health care, language training, and job counseling would be less accessible.
Without coordinated investments, cities would risk increased rents, longer government wait times, and mounting pressure on schools and hospitals.
Moreover, these are conditions that unfairly burden recent immigrants and low-income Canadians the most.
Interventions and Solutions to Housing Issues in Winnipeg
As immigrant populations in Winnipeg continue to grow, government interventions have been aimed at responding to housing pressures associated with population growth.
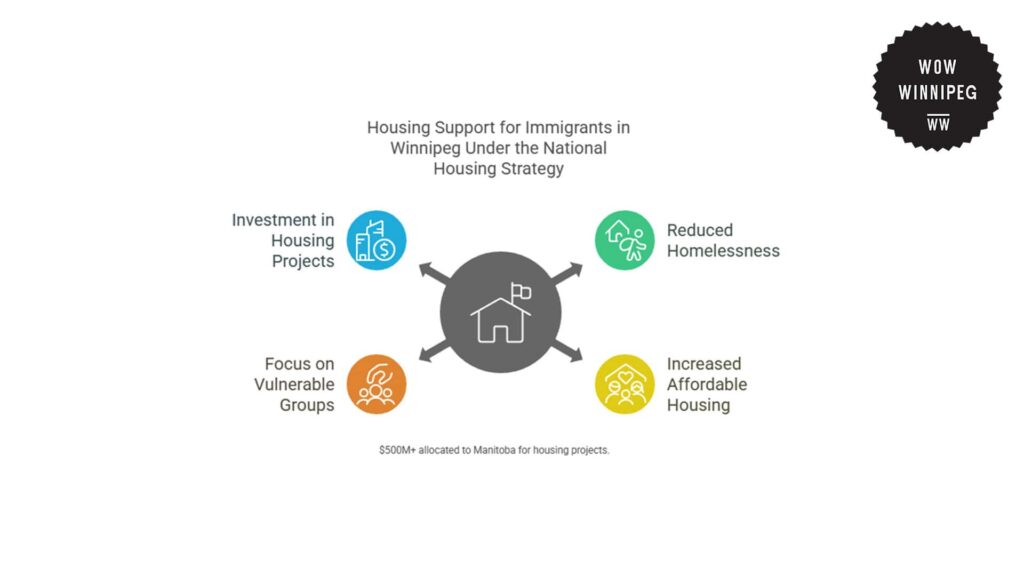
The Manitoba government collaborates with the Canada Mortgage and Housing Corporation (CMHC) under the National Housing Strategy, a federal strategy initiated in 2017.
The strategy hopes to reduce homelessness by 50% and increase access to affordable housing. It focuses on vulnerable populations such as low-income families, seniors, Indigenous peoples, and immigrants.
Funding is invested in constructing and rehabilitating lower-cost housing in neighborhoods that face increased housing pressure.
To enable these initiatives, more than $500 million has been invested in Manitoba through the National Housing Strategy.
The Future of Immigration Trends in Winnipeg
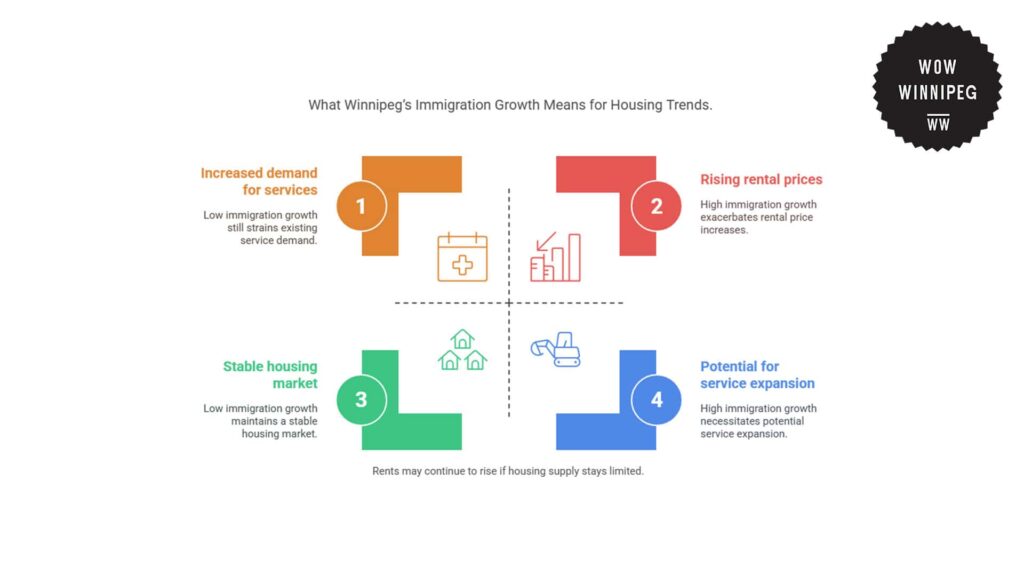
From 2017 to 2021 alone, Winnipeg received more than 72,900 permanent residents. Moving forward, Winnipeg may reach well over 80,000 immigrants by the year 2026.
Based on these existing patterns, continued growth in the city’s immigrant population may put increased pressure on housing needs over the next several years.
Without more interventions from the government and expansions in affordable housing, rental prices in areas with high concentrations of immigrants may continue to rise.
Moreover, these high prices also drive up the cost of living for residents, which may also impact other key services like health care, education, job counseling, and language training.
All of these issues will continue to affect both immigrant and local populations in these areas and will disadvantage the most vulnerable individuals.
References
- Immigration Manitoba. (2021). Facts & figures report 2021. https://immigratemanitoba.com/data/facts-report-2021/
- Statista. (2023). Number of immigrants in Canada from 2000 to 2023. https://www.statista.com/statistics/444906/number-of-immigrants-in-canada/
- Statistics Canada. (n.d.). Statistics Canada home page. https://www.statcan.gc.ca/en/start
- Statistics Canada. (2021). Census profile, 2021 census of population: Winnipeg [Census subdivision], Manitoba. https://www12.statcan.gc.ca/census-recensement/2021/dp-pd/prof/details/page.cfm?Lang=E&SearchText=Winnipeg&DGUIDlist=2021S05101036&GENDERlist=1,2,3&STATISTIClist=1&HEADERlist=0
- Canadian Alliance to End Homelessness. (2021). Federal Budget 2021 – What it means for homelessness in Canada. https://caeh.ca/budget-2021-analysis/?gad_source=1&gclid=Cj0KCQiAs5i8BhDmARIsAGE4xHy8x0QVEPt4z0cbrGhdmvcISBaIleCJsDqtMhpihACRb5YrljP_VL8aAojhEALw_wcB
- Statistics Canada. (2022). Census Profile, 2021 Census of Population: Winnipeg [Census metropolitan area], Manitoba. https://www12.statcan.gc.ca/census-recensement/2021/as-sa/fogs-spg/page.cfm?lang=E&topic=9&dguid=2021S0503602
- Tasker, J. P. (2024, January 10). The government was warned 2 years ago that immigration would make housing more expensive, internal documents show. CBC News. https://www.cbc.ca/news/politics/ircc-immigration-housing-canada-1.7080376