
Winnipeg’s Leading Causes of Death: Statistics and Trends

Key Insights
| Statistics Canada shows that in 2022, the leading cause of death in Canada was malignant neoplasms, with 82,412 reported cases. Data from the Manitoba Health Annual Statistics 2020-2021 shows that cancer was the leading cause of death in Manitoba, representing 26% of all deaths in the province. The same report shows that from 2019-2020, the infant mortality rate for both sexes was 4.5 per 1,000 live births. According to the National Library of Medicine, if the level of physical inactivity in the country is reduced by 10%, this could save the health system $150 million annually. To prevent premature deaths, the Winnipeg Regional Health Authority (WRHA) has initiated a series of health interventions related to cancer, heart disease, diabetes, and respiratory conditions, among others. |
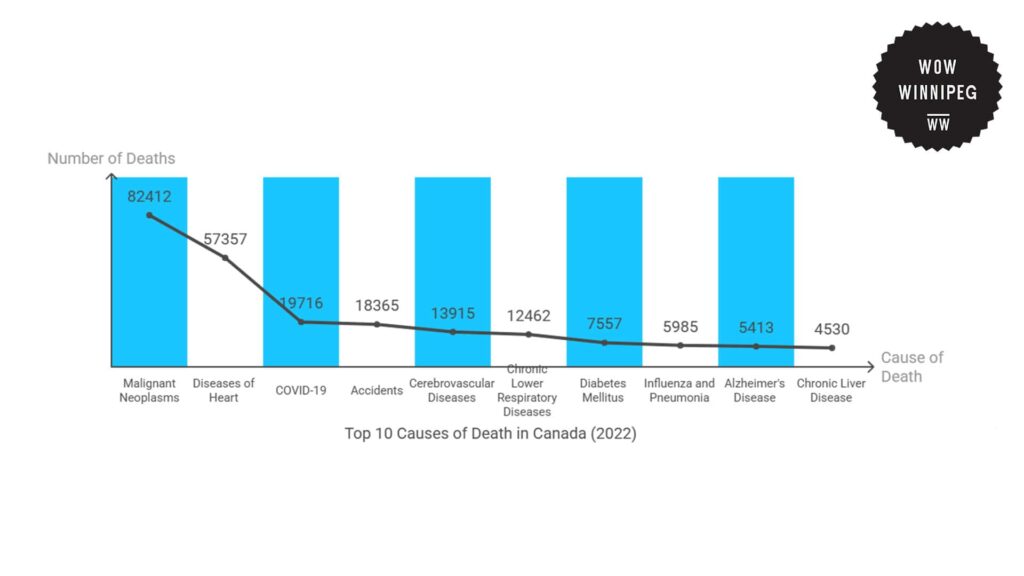
According to data from Statistics Canada, malignant neoplasms were the number one cause of death in Canada in 2022, resulting in 82,412 out of a total of 334,081 deaths.
This number, although slightly down from the 82,822 deaths in 2021, is part of a pattern in which cancer remains number one among all causes of death.
In contrast, diseases of the heart caused 57,357 deaths in 2022, which is a 3.8% increase from 2021.
COVID-19 was the third leading cause in 2022 with 19,716 deaths, which is a rise of 36.3% from 2021.
Even though this is a lower rate than during the pandemic’s peak in 2020, this increase highlighted the ongoing effect of the virus on population mortality, especially in more vulnerable populations.
Meanwhile, accidental fatalities fell from 19,257 in 2021 to 18,365 in 2022, which is a decrease of 4.6%. These fatal accidents include falls, transport accidents, and other unintentional injuries.
Deaths from cerebrovascular disease, including stroke, increased slightly from 13,491 to 13,915 in 2022, which is an increase of 3.1%. This kept the category in fifth position for both 2021 and 2022.
Similarly, deaths due to chronic lower respiratory diseases also increased by 13.1%, from 11,018 to 12,462, reflecting concerns about long-term lung issues like those caused by smoking.
Deaths due to diabetes were fairly constant at 7,557, which is only up by 1.1% from the previous year.
Conversely, deaths from influenza and pneumonia increased substantially by 45.4%, up from 4,115 to 5,985. This is possibly due to changes in population health behavior and immunity following the relaxing of pandemic control measures.
Alzheimer’s disease, chronic liver disease, and kidney conditions remained in the bottom half of the top 10, each at numbers below 7,500 deaths.
At the lowest position, though still relevant, are deaths caused by intentional self-harm or suicide, with 3,593 cases in 2022.
| 2019 | 2020 | 2021 | 2022 | 2019 | 2020 | 2021 | 2022 | |
| number of deaths | number of deaths | number of deaths | number of deaths | rank | rank | rank | rank | |
| Total, all causes of death | 285,301 | 308,412 | 311,640 | 334,081 | … | … | … | … |
| Malignant neoplasms | 80,372 | 81,242 | 82,822 | 82,412 | 1 | 1 | 1 | 1 |
| Diseases of heart | 53,364 | 54,430 | 55,271 | 57,357 | 2 | 2 | 2 | 2 |
| COVID-19 | … | 15,890 | 14,466 | 19,716 | … | 4 | 4 | 3 |
| Accidents (unintentional injuries) | 15,527 | 16,818 | 19,257 | 18,365 | 3 | 3 | 3 | 4 |
| Cerebrovascular diseases | 13,717 | 13,761 | 13,491 | 13,915 | 4 | 5 | 5 | 5 |
| Chronic lower respiratory diseases | 12,902 | 11,844 | 11,018 | 12,462 | 5 | 6 | 6 | 6 |
| Diabetes mellitus | 6,987 | 7,654 | 7,472 | 7,557 | 6 | 7 | 7 | 7 |
| Influenza and pneumonia | 6,945 | 6,037 | 4,115 | 5,985 | 7 | 8 | 10 | 8 |
| Alzheimer’s disease | 6,181 | 5,788 | 5,471 | 5,413 | 8 | 9 | 8 | 9 |
| Chronic liver disease and cirrhosis | 3,708 | 4,199 | 4,617 | 4,530 | 11 | 10 | 9 | 10 |
| Nephritis, nephrotic syndrome, and nephrosis | 3,770 | 4,065 | 3,978 | 4,234 | 10 | 12 | 11 | 11 |
| Intentional self-harm (suicide) | 4,581 | 4,152 | 3,769 | 3,593 | 9 | 11 | 12 | 13 |
| Other ill-defined and unspecified causes of mortality | 3,378 | 6,841 | 9,471 | 16,043 | … | … | … | … |
Leading Causes of Death in Manitoba
The Manitoba Health Annual Statistics 2020-2021 gives insights into the leading causes of death in the province.
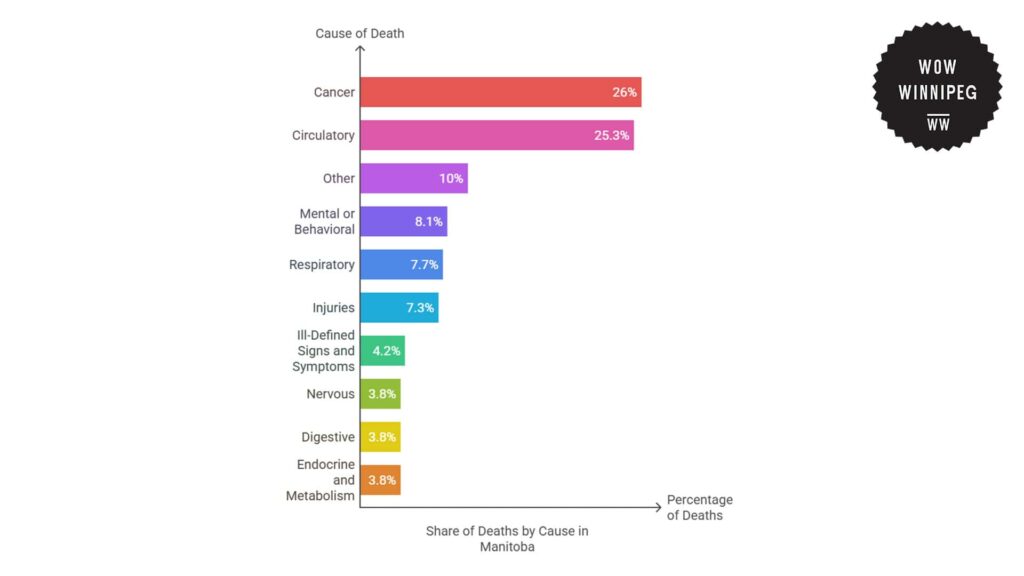
Cancer was the leading cause of death in Manitoba, which was responsible for 26% of all fatalities. This is aligned with national trends, where malignant neoplasms are also at the top of the list.
Closely following this were circulatory diseases, which accounted for 25.3% of all deaths. This group includes people with conditions such as ischemic heart disease, stroke, and other disorders of the heart and blood vessels.
Combined, cancer and circulatory diseases were responsible for over half of all deaths in the province, which highlights their large impact on the population’s health.
The third-largest category, labeled “Other,” accounted for 10%. This group typically includes less common categories that do not fall under standard classifications but still contribute significantly to overall mortality.
Mental and behavioral disorders, including conditions like dementia and those related to substance use, were responsible for 8.1% of all deaths.
This shows a potential need for expanded mental health intervention and public health funding in the province.
Meanwhile, respiratory conditions, such as chronic obstructive pulmonary disease and pneumonia, accounted for 7.7% of deaths.
Injuries followed closely at 7.3%, which includes both unintentional incidents like falls or traffic accidents and potentially intentional harm such as suicide.
Notably, ill-defined signs and symptoms, which are often used as a label when the precise cause of death is unclear, made up 4.2% of the total.
Finally, the bottom three categories each accounted for 3.8% of deaths. These included nervous system disorders, digestive diseases, and endocrine and metabolic conditions such as diabetes.
These categories, though lower in overall share, still represent hundreds of individual deaths annually and require continued monitoring to understand shifting trends and causes.
Collectively, these figures illustrate how a range of chronic diseases and external causes contribute to mortality in Manitoba, with cancer and circulatory issues remaining the most critical areas of concern.
| Cause | Percentage |
| Cancer | 26% |
| Circulatory | 25.3% |
| Other | 10% |
| Mental or Behavioral | 8.1% |
| Respiratory | 7.7% |
| Injuries | 7.3% |
| Ill-Defined Signs and Symptoms | 4.2% |
| Nervous | 3.8% |
| Digestive | 3.8% |
| Endocrine and Metabolism | 3.8% |
Infant Mortality Trends in Manitoba
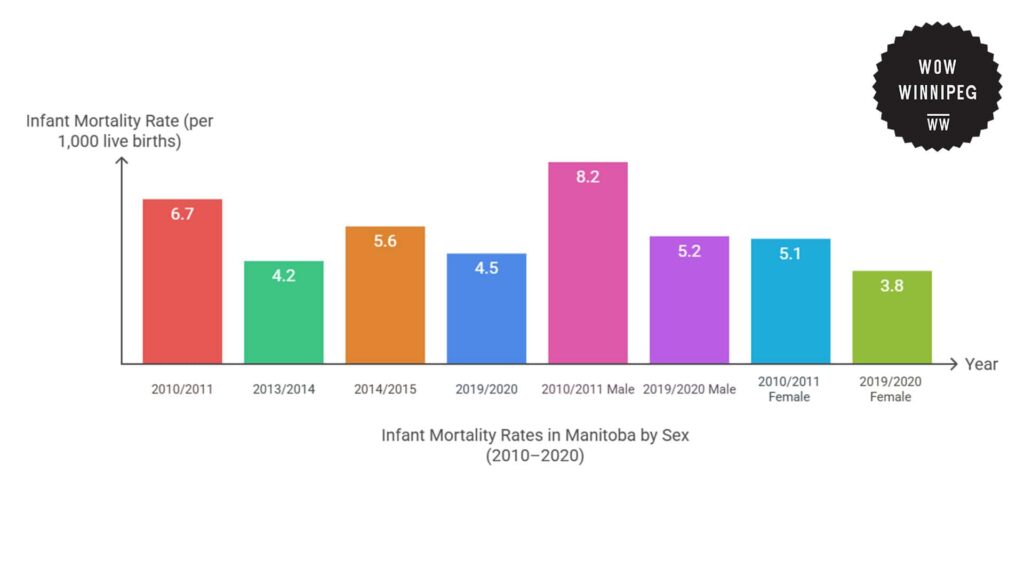
Data from the Government of Manitoba shows that during the period from 2010 to 2020, the province’s infant mortality rate has decreased, though with some fluctuations over the past decade.
The crude infant death rate for 2010–2011 was 6.7 per 1,000 live births. While this number decreased to 4.2 in 2013–2014, rates again increased in the following years to 5.6 in 2014–2015, which is a rise of 33%.
Meanwhile, the following years continued to show some fluctuations, with the rate varying between 4.5 and 5.6 before stabilizing at 4.5 in 2019–2020. This rate is a 32.8% drop from the 2010–2011 value.
When looking at the data by sex, some inequalities are revealed. For all the years throughout the decade, male infants experienced higher mortality rates compared to female infants.
For example, male infant mortality was 8.2 per 1,000 live births in 2010–2011, versus 5.1 for females, which is a difference of 60.8%.
By 2019–2020, male infant mortality was 5.2, while the female rate had fallen to 3.8. This 1.4-point gap highlights the need to take into account biological determinants of infant health by sex.
| Year | Manitoba | Male | Female |
| 2010/2011 | 6.7 | 8.2 | 5.1 |
| 2011/2012 | 6.8 | 7.5 | 6.1 |
| 2012/2013 | 5.2 | 4.9 | 5.6 |
| 2013/2014 | 4.2 | 4.6 | 3.8 |
| 2014/2015 | 5.6 | 6.6 | 4.4 |
| 2015/2016 | 5 | 4.5 | 5.5 |
| 2016/2017 | 4.8 | 5.8 | 3.7 |
| 2017/2018 | 5.4 | 5.5 | 5.3 |
| 2018/2019 | 5.6 | 5.5 | 5.8 |
| 2019/2020 | 4.5 | 5.2 | 3.8 |
Costs and Consequences of High Mortality Rates
The National Library of Medicine shows how premature death not only impacts families and communities socially and emotionally but also creates enormous economic costs.
The report shows how an estimated $2.1 billion of direct healthcare expenditures were attributed to physical inactivity-related diseases. This accounted for 2.5% of the total costs of the healthcare system.
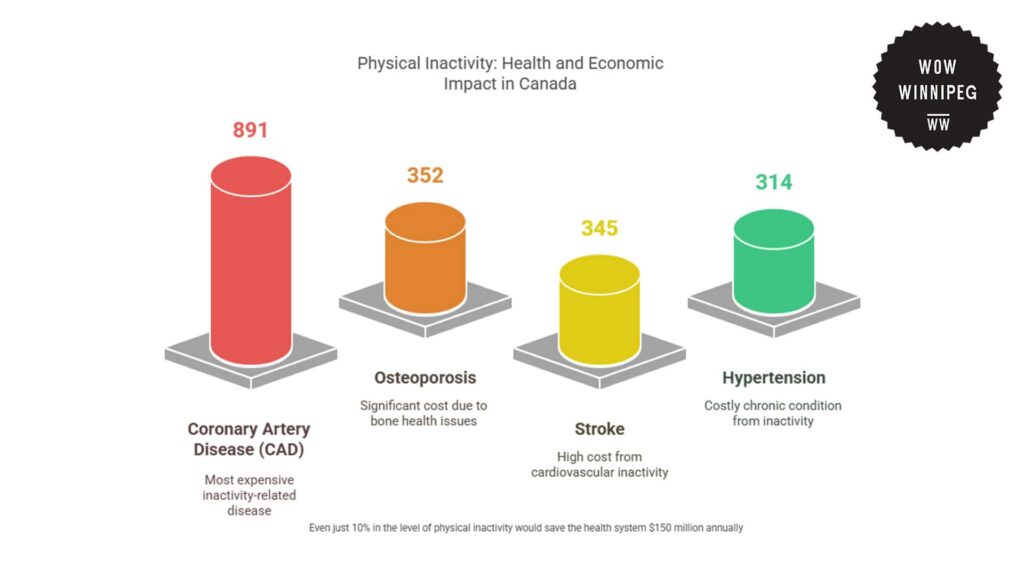
Moreover, these costs were not restricted to a single condition. Instead, this included several chronic ailments such as coronary artery disease (CAD), stroke, colon cancer, breast cancer, type 2 diabetes, hypertension, and osteoporosis.
The cost breakdown shows that coronary artery disease (CAD) was the most expensive condition tied to inactivity, with $891 million in health care costs. Osteoporosis followed at $352 million, while stroke was at $345 million, and hypertension was at $314 million.
Combined, these four chronic diseases represented well over 90% of overall inactivity-based expenditures.
These illustrate how inactivity not only causes increased individual health threats but also, in the longer term, leads to increased healthcare costs through the treatment of avoidable chronic diseases.
However, the cost of inactivity is more than just economic. Inactivity is also attributed to issues like heart disease, diabetes, and cancer.
Although it is impossible to avoid all premature deaths, the study indicates that as many as one-third of these deaths might have been prevented through regular physical activity.
The report also shows that a decrease of even just 10% in the level of physical inactivity would save the health system $150 million annually.
Though these savings may not be felt by individuals immediately, these would increase over time as the cumulative benefits of exercise compound.
For example, more active individuals require fewer medications and hospital admissions and are less likely to experience complications arising from chronic illness.
In a province such as Manitoba, where cancer and circulatory disease are the leading causes of death, these results are especially relevant.
Moreover, several of the other illnesses that rank high in Manitoba’s leading causes of death, like heart disease, stroke, and diabetes, all have links with physical inactivity.
| Disease or Condition | Cost (in millions CAD) |
| Coronary Artery Disease (CAD) | $891 million |
| Osteoporosis | $352 million |
| Stroke | $345 million |
| Hypertension | $314 million |
| Total (selected diseases) | $1.902 billion |
Interventions and Solutions to Health Issues in Winnipeg
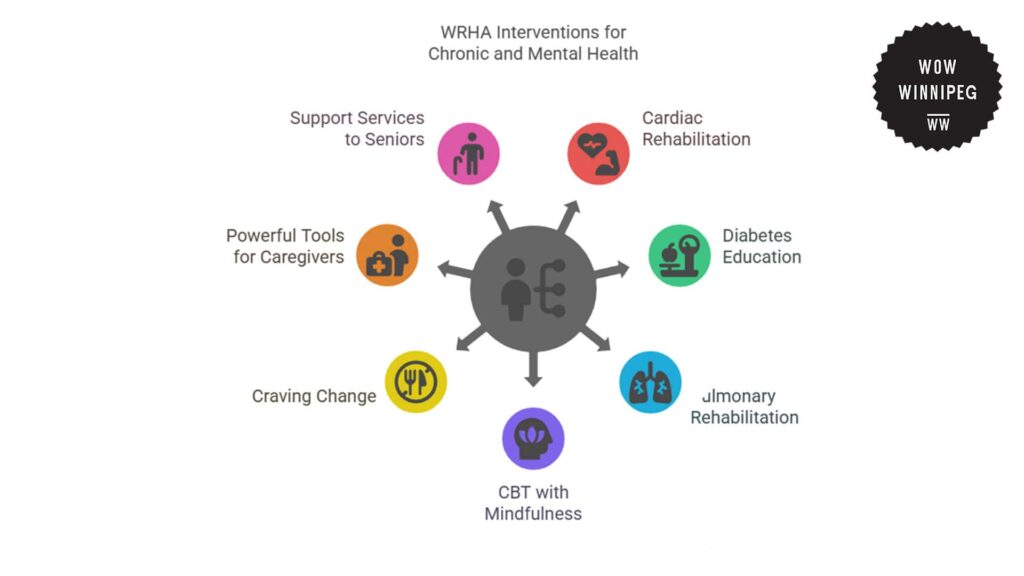
The Winnipeg Regional Health Authority (WRHA) provides a variety of intervention programs to decrease the prevalence of the major causes of death in Manitoba, including cancer, heart disease, diabetes, and respiratory conditions.
These services are intended not only for chronic illness management but also for encouraging healthier habits and better long-term outcomes.
To treat chronic diseases, the WRHA provides specialized services such as cardiac rehabilitation and diabetes education.
The cardiac rehabilitation program assists patients recovering from heart conditions with exercise training, nutrition seminars, and education on minimizing cardiovascular risk.
Likewise, the diabetes education program teaches patients how to manage blood glucose, change their diet, and include physical activity. These are strategies that are critical in preventing type 2 diabetes complications.
For patients with chronic respiratory diseases like chronic obstructive pulmonary disease (COPD), the pulmonary rehabilitation program includes breathing exercises, physical conditioning, and health education to enhance quality of life.
Mental and behavioral health services are also a part of the WRHA’s plan. Cognitive Behavioral Therapy with Mindfulness (CBTM) assists patients in managing anxiety, depression, and stress, which are factors commonly associated with chronic disease.
Another program, Craving Change, assists patients in recognizing the psychological drivers for poor eating patterns and assists them in adopting healthier, more sustainable behaviors.
In response to the needs of older populations and informal caregivers, the WRHA also provides services like Powerful Tools for Caregivers, which educates individuals in self-care and stress management skills.
Meanwhile, Support Services to Seniors links older adults with resources that enable them to live independently and access appropriate health and community services.
Overall, the programs offer a multi-level intervention approach, addressing not only the medical symptoms of chronic disease but also the behavioral and social factors that lead to poor health outcomes.
| WRHA Program | Health Concern |
| Cardiac Rehabilitation | Heart diseases |
| Diabetes Education | Diabetes |
| Pulmonary Rehabilitation | Chronic respiratory illness |
| CBT with Mindfulness | Mental health |
| Craving Change | Behavioral eating |
| Powerful Tools for Caregivers | Caregiver stress |
| Support Services to Seniors | Senior health |
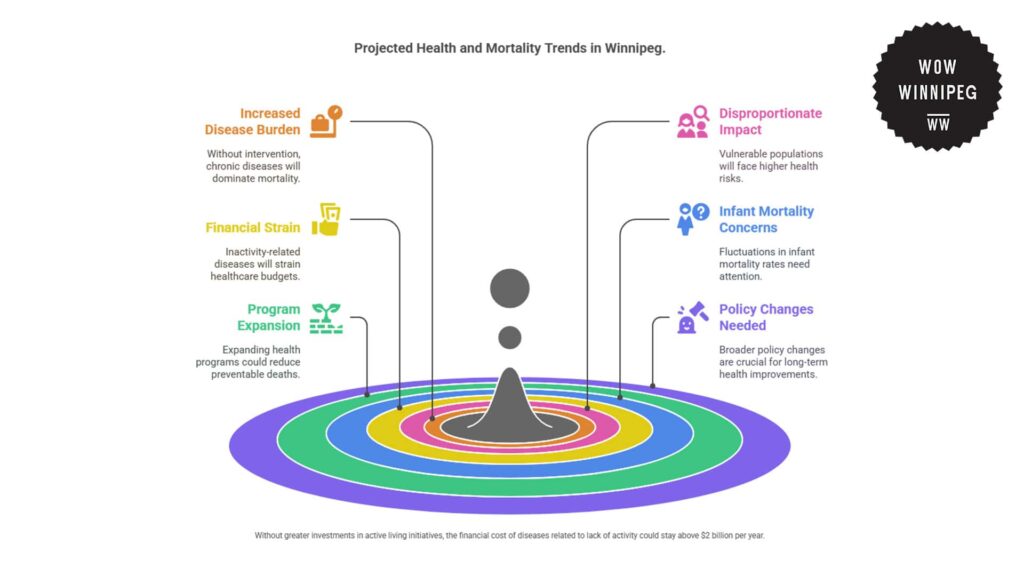
The Future of Health and Mortality Trends in Winnipeg
Based on current trends, circulatory diseases and cancer will continue to be the dominant causes of death in Winnipeg throughout the coming decade.
These conditions have consistently ranked high in the leading causes of death for both national and provincial trends over the past years. This highlights their deep impact on the population in Winnipeg.
Combined, they currently represent more than 50% of all deaths in the province. Unless there are major breakthroughs in early detection or prevention, the burden of these conditions will likely increase.
These conditions will also disproportionately affect vulnerable populations, like older individuals or those with low physical activity levels.
Moreover, without greater investments in active living initiatives, the financial cost of diseases related to a lack of activity could stay above $2 billion per year.
Inactivity-related conditions such as heart disease, stroke, and diabetes are already major contributors to the country’s mortality and healthcare spending, and these costs are projected to rise if no interventions are implemented.
A 10% drop in inactivity rates could reduce this cost by $150 million per year, but reaching this target would require coordinated efforts across sectors.
Meanwhile, infant mortality rates, while lower than in 2010, have not declined consistently. If current fluctuations continue without stronger maternal and child health strategies, Manitoba may struggle to reach continued improvements.
If WRHA prevention programs expand and reach more residents, especially in areas like cardiac rehab, diabetes management, and mental health, some reductions in preventable deaths may be possible.
These programs have already shown some promise in addressing chronic disease risk factors and improving overall community health. Thus, these could be expanded further so they can reach a wider group of people.
However, without broader policy changes and sustained public health funding, Winnipeg is likely to see continued pressure from chronic disease and premature death over the next 10 years.
References
- Statistics Canada. (2023, November 27). Table 13-10-0810-01 Leading causes of death, total population, by age group. https://www150.statcan.gc.ca/n1/daily-quotidien/231127/t001b-eng.htm
- Government of Manitoba. (2022). Annual statistics 2021: Health information management. https://www.gov.mb.ca/health/annstats/as2021.pdf
- Winnipeg Regional Health Authority. (2004). Community health assessment report: Volume 3 – Determinants of health. https://wrha.mb.ca/files/cha-2004-vol-3-P1M1C1S3ID9.pdf
- Canadian Mental Health Association. (2024). State of mental health profile: Manitoba. https://cmha.ca/wp-content/uploads/2024/11/State-of-Mental-Health-profile-Manitoba.pdf
- Katzmarzyk, P. T., Gledhill, N., & Shephard, R. J. (2000). The economic burden of physical inactivity in Canada. Canadian Medical Association Journal, 163(11), 1435–1440. https://pmc.ncbi.nlm.nih.gov/articles/PMC80410/
- Winnipeg Regional Health Authority. (n.d.). The Plan: WRHA strategic plan 2023–2028. https://wrha.mb.ca/theplan/
- Winnipeg Regional Health Authority. (n.d.). Cardiac rehabilitation. https://wrha.mb.ca/groups/cardiac-rehabilitation/
- Winnipeg Regional Health Authority. (n.d.). Diabetes education program. https://wrha.mb.ca/groups/diabetes/
- Winnipeg Regional Health Authority. (n.d.). Pulmonary rehabilitation. https://wrha.mb.ca/groups/pulmonary-rehabilitation/
- Winnipeg Regional Health Authority. (n.d.). Cognitive behavioral therapy with mindfulness (CBTm). https://wrha.mb.ca/groups/cbtm/
- Winnipeg Regional Health Authority. (n.d.). Craving Change program. https://wrha.mb.ca/groups/craving-change/
- Winnipeg Regional Health Authority. (n.d.). Powerful tools for caregivers. https://wrha.mb.ca/groups/powerful-tools-for-caregivers/
- Winnipeg Regional Health Authority. (n.d.). Support services to seniors: System navigators. https://wrha.mb.ca/support-services-to-seniors/system-navigators/