
The Reality of Minimum Salary in Winnipeg: Earnings, Expenses, and Challenges

Key Insights
| A report by CalcuCoversion shows that Manitoba’s minimum wage was set at $18.50 per hour as of October 1, 2024. The Retail Council of Canada highlights that the province’s minimum wage sits above Saskatchewan ($15.00) and Alberta ($15.00) but remains lower than Ontario ($17.20). Research from AreaVibes indicates that neighborhoods such as Heubach Park and Old Tuxedo have a cost of living index 15 to 20% higher than the city’s average. Findings from Statistics Canada reveal a persistent gender wage gap in the city, with men earning $57,000 annually in 2022, while women earned $44,500 during the same period. Data from Policy Options Politiques illustrates that in the fourth quarter of 2023, the wealthiest 20% of Canadians controlled 67.7% of the country’s total wealth. |
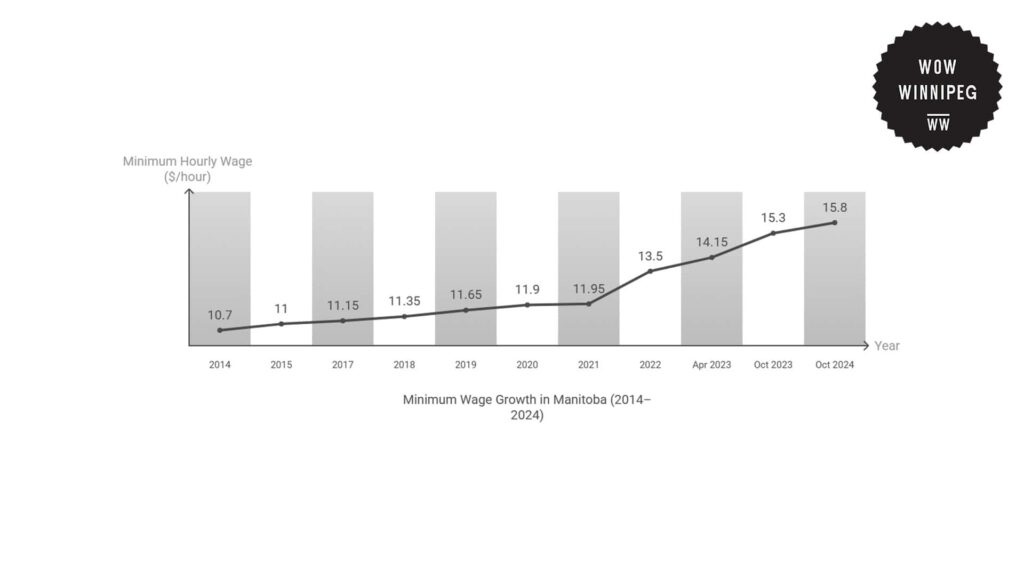
According to CalcuConversion, Manitoba’s minimum wage has steadily increased over the past decade.
On October 1, 2024, the minimum wage in the city was $15.80 an hour, which was up by 3.3% from $15.30 an hour in October 2023.
This means that a standard 36.8-hour workweek equals a weekly salary of $581.44 and a yearly salary of $30,234.88 before taxes.
During the last decade, Manitoba’s minimum wage rose 47.7% to its present value from $10.70 in 2014.
The largest short-term wage hike happened in April 2023, when wages went up from $13.50 to $14.15 per hour, which was a 4.8 percent hike within six months.
This hike occurred as a response to rising concerns that wages were not keeping pace with inflation, which had grown following supply chain breakdowns and economic uncertainty triggered by the pandemic.
| Date | Minimum Hourly Wage ($/hour) | Weekly Wage (36.8 hours/week) ($/week) | Annual Salary (52 weeks) ($/year) | % Change in Annual Salary (YoY) |
| Oct 2024 | 15.8 | 581.44 | 30,234.88 | 0.033 |
| Oct 2023 | 15.3 | 563.04 | 29,278.08 | 0.081 |
| Apr 2023 | 14.15 | 520.72 | 27,077.44 | 0.048 |
| Oct 2022 | 13.5 | 496.8 | 25,833.60 | 0.129 |
| Oct 2021 | 11.95 | 439.76 | 22,867.52 | 0.004 |
| Oct 2020 | 11.9 | 437.92 | 22,771.84 | 0.021 |
| Oct 2019 | 11.65 | 428.72 | 22,293.44 | 0.027 |
| Oct 2018 | 11.35 | 417.68 | 21,719.36 | 0.018 |
| Oct 2017 | 11.15 | 410.32 | 21,336.64 | 0.014 |
| Oct 2015 | 11 | 404.8 | 21,049.60 | 0.028 |
| Oct 2014 | 10.7 | 393.76 | 20,475.52 | — |
Regional Analysis of Wages Across Canada
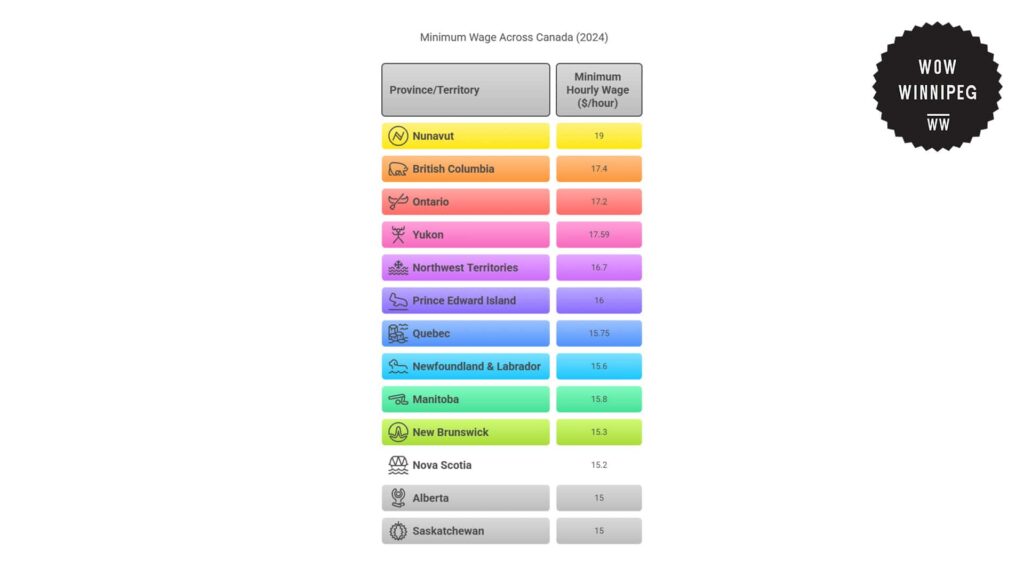
The Retail Council of Canada indicates that minimum wage rates across Canada vary significantly by province and territory.
At a rate of $15.80 per hour as of 2024, Manitoba’s minimum wage ranks in the middle among provincial rates.
Manitoba’s rate is slightly higher than that of Saskatchewan ($15.00) and Alberta ($15.00) but lower than Ontario ($17.20) and British Columbia ($17.40).
Among Canada’s provinces, Nunavut has the highest minimum wage at $19.00 per hour. Yukon ($17.59) and the Northwest Territories ($16.70) also enjoy relatively high wages for the same reasons.
Prince Edward Island ($16.00), Nova Scotia ($15.20), and New Brunswick ($15.30) are at the lower end with rates similar to Manitoba despite differences in economic conditions and population size.
With growing inflation and expenses, more hikes will most probably be demanded in certain provinces to maintain employees’ buying power.
| Province/Territory | Minimum Hourly Wage ($/hour) |
| Nunavut | 19 |
| British Columbia | 17.4 |
| Ontario | 17.2 |
| Yukon | 17.59 |
| Northwest Territories | 16.7 |
| Prince Edward Island | 16 |
| Quebec | 15.75 |
| Newfoundland & Labrador | 15.6 |
| Manitoba | 15.8 |
| New Brunswick | 15.3 |
| Nova Scotia | 15.2 |
| Alberta | 15 |
| Saskatchewan | 15 |
Cost of Living in Winnipeg Neighborhoods
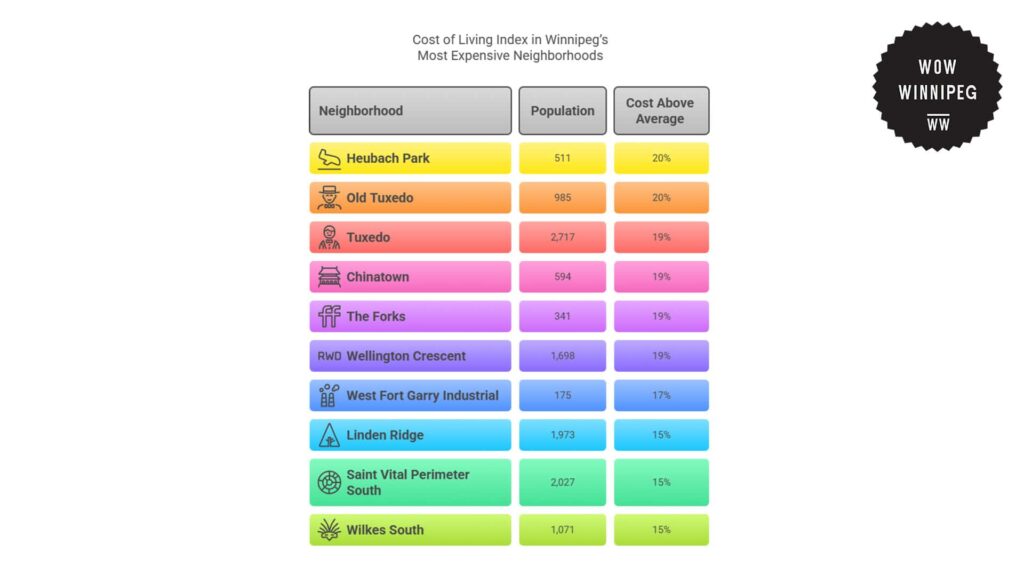
AreaVibes data shows that the cost of housing and living in some of Winnipeg’s priciest neighborhoods exceeds what a minimum-wage earner can reasonably manage.
These higher-end neighborhoods, with a cost of living index that is 15 to 20% above the city average of 78, take a much greater percentage of income for rent and necessities, rendering them unaffordable to low-wage workers.
In Heubach Park, which has 511 residents, the cost of living is 20% above Winnipeg’s average, and it is the city’s most pricey neighborhood. Old Tuxedo, with 985 residents, also has a rate of 20% above the city average.
Moreover, neighborhoods like Tuxedo, Chinatown, The Forks, and Wellington Crescent also all have cost of living indexes 19% higher than the city average, making it out of range for much of the lower-income population.
This economic pressure carries over into West Fort Garry Industrial, Linden Ridge, Saint Vital Perimeter South, and Wilkes South, where the cost of living is 15% to 17% above the citywide average.
Even in these comparatively less costly districts, minimum-wage employees would not be able to afford rent, utilities, and other needs without going beyond recommended earnings levels.
This is especially problematic for workers in necessary but lower-paying sectors like retail, hospitality, and caregiving, many of whom have to travel long distances from less expensive regions.
| Neighborhood | Population | Cost of Living Index | Percentage Above Winnipeg’s Average of 78 |
| Heubach Park | 511 | 94 vs 78 | 20 |
| Old Tuxedo | 985 | 94 vs 78 | 20 |
| Tuxedo | 2,717 | 93 vs 78 | 19 |
| Chinatown | 594 | 93 vs 78 | 19 |
| The Forks | 341 | 93 vs 78 | 19 |
| Wellington Crescent | 1,698 | 93 vs 78 | 19 |
| West Fort Garry Industrial | 175 | 91 vs 78 | 17 |
| Linden Ridge | 1,973 | 90 vs 78 | 15 |
| Saint Vital Perimeter South | 2,027 | 90 vs 78 | 15 |
| Wilkes South | 1,071 | 90 vs 78 | 15 |
Gender Disparities in Manitoba’s Income Trends
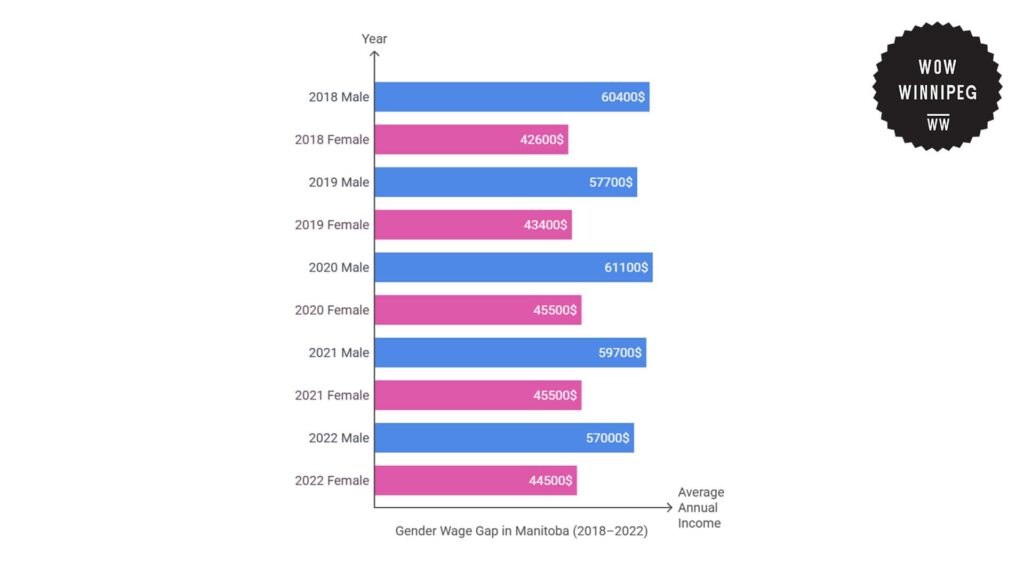
Data from Statistics Canada reveals a broad gender wage gap in Manitoba’s income distribution, as males earn higher average and median incomes compared to female workers.
In 2022, the average annual income for males in Manitoba was $57,000, while that for females was $44,500. This is a 22% income gap where women earn significantly less than men.
The gap also appears in median wages, with men having a median of $46,900 versus women’s lower median of $35,900, indicating structural pay differences by industry and employment type.
From 2018 to 2022, female income increased a little from $42,600 in 2018 to $44,500 in 2022, which is an increase of 4.5% over 5 years. Meanwhile, men’s income fell from $60,400 to $57,000, which is a 5.6% decline.
Despite this growth, women’s wages remain substantially lower than those of men, reflecting that the wage gap remains an issue in Manitoba.
The overall earnings data also shows the salary gap, as men received a total of $29.45 billion in 2022 while women received $23.44 billion.
While the number of working women increased from 503,000 in 2018 to 527,000 in 2022, their overall earnings remain lower. This further illustrates the continuing challenges women face in securing higher-paying occupations.
These pay gaps are the result of various systemic and social issues, including occupational segregation, dependence on part-time employment, and disparities in industry representation.
| Year | Male Average Income ($) | Female Average Income ($) | Male Median Income ($) | Female Median Income ($) | Male Aggregate Income (Billion $) | Female Aggregate Income (Billion $) |
| 2018 | 60,400 | 42,600 | 47,500 | 34,400 | 29.99 | 21.44 |
| 2019 | 57,700 | 43,400 | 47,700 | 35,300 | 28.83 | 22.24 |
| 2020 | 61,100 | 45,500 | 49,600 | 37,800 | 31.01 | 23.41 |
| 2021 | 59,700 | 45,500 | 47,800 | 37,900 | 30.37 | 23.42 |
| 2022 | 57,000 | 44,500 | 46,900 | 35,900 | 29.45 | 23.44 |
Costs and Consequences of Income Inequality
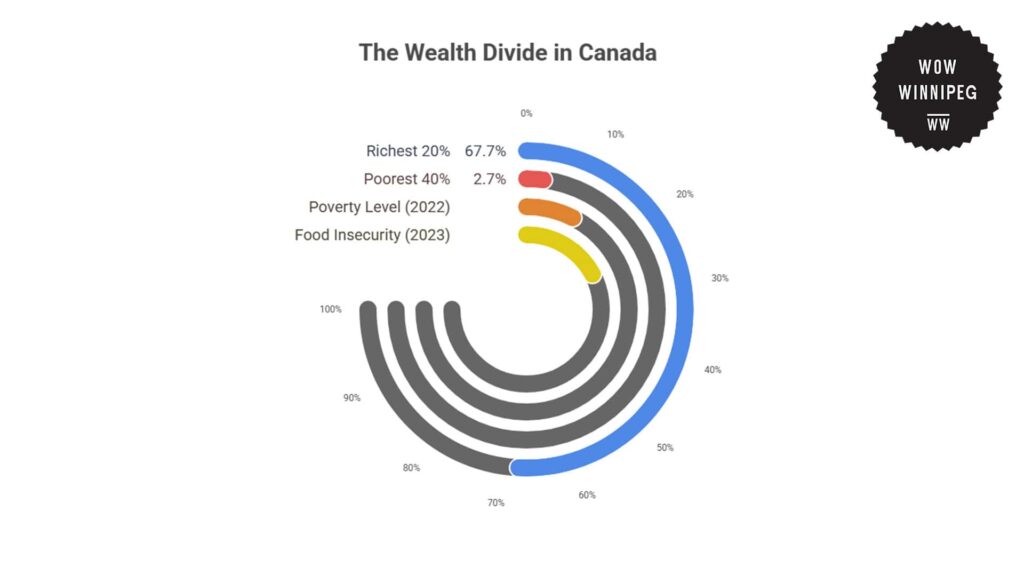
A report by the Policy Options Politiqies shows how Canadian wealth and income inequalities have reached staggering levels and caused significant social and economic consequences.
For example, the richest 20% of Canadians held 67.7% of the country’s wealth in the fourth quarter of 2023. This amounts to an average of $3.3 million per household.
In contrast, the poorest 40% of the population had only 2.7% of the total wealth, which is an average of $67,038 per household.
This disparity has far-reaching implications for poorer families. In 2022, Canada’s poverty level increased to 9.9% from 7.4% in 2021.
Moreover, food insecurity also grew. This affected 22.9% of households in 2023, which is higher than the 18.5% affected in 2022.
Furthermore, rising living costs, especially for essential items like food, energy, and shelter, impose heavier economic burdens on low-income and vulnerable groups.
Very low-income families spend more than 100% of their pre-government-transfers disposable income on essentials, which then leads to an increased reliance on credit and social welfare programs.
The consequences of this inequality extend beyond the individual affected. Economic inequalities also have the potential to slow down aggregate economic growth, reduce social cohesion, and increase public health expenditure.
Interventions and Solutions to Wealth Inequality in Winnipeg
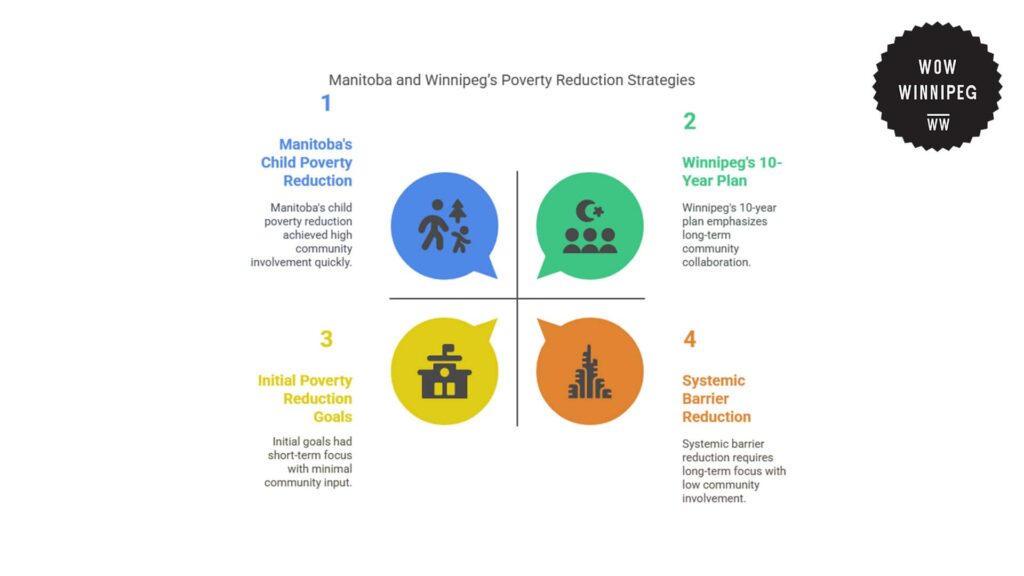
The governments of Manitoba and Winnipeg have introduced targeted poverty reduction initiatives in the areas of employment, social inclusion, and community partnership.
Manitoba’s Poverty Reduction Strategy, “Pathways to a Better Future,” targets a 25% reduction in child poverty by 2025 and has already achieved considerable progress.
For example, the rate of child poverty was reduced from 19.3% in 2015 to 6% in 2020, which exceeded the project’s initial goals.
Their approach prioritizes investment in young people and children, job support, affordable housing, food security, health, and Indigenous partnerships.
They monitor progress through indicators such as the Market Basket Measure, employment rates, and housing data.
Moreover, Winnipeg’s Poverty Reduction Strategy is a 10-year plan to overcome systemic barriers and advance equity between communities.
The 2024-2027 implementation plan sets out concrete actions across city departments, with considerations for funding embedded in Winnipeg’s multi-year budget.
This strategy was co-created in consultation with communities to ensure that it addresses lived experiences and local needs.
Overall, both plans at the city and regional levels emphasize collaborative efforts among government, community groups, and individuals.
These initiatives reflect a focus on long-term, organized solutions designed to enhance economic security and quality of life for poorer residents.
Future Trends for Minimum Salaries and Income Inequality in Winnipeg
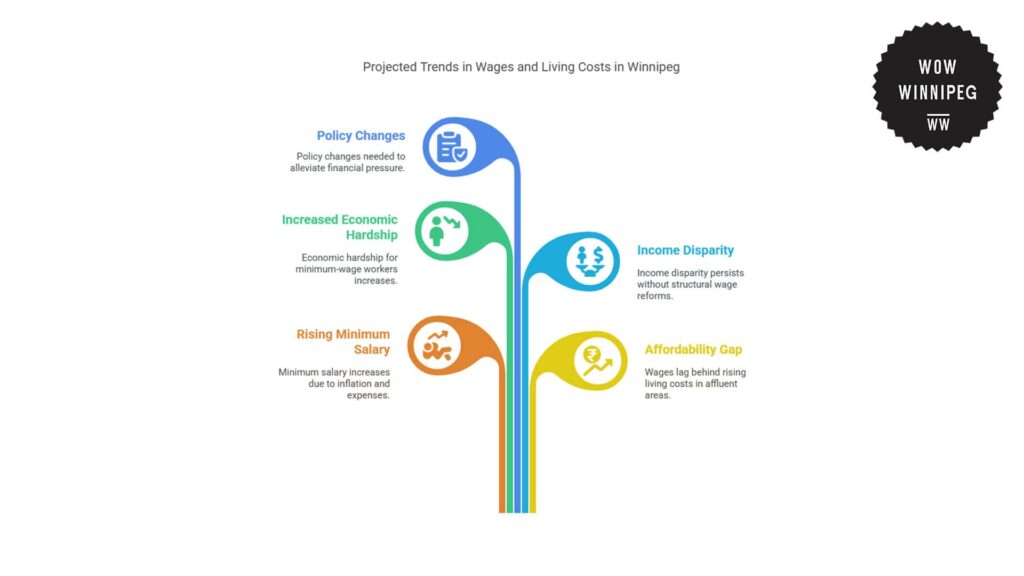
The minimum salary in Winnipeg is anticipated to keep rising due to inflation and higher living expenses.
However, growth in wages may not be enough to bridge the affordability gap, particularly in affluent neighborhoods where rent and basic living costs exceed earnings.
If the cost of living and housing prices keep growing more quickly than salaries, minimum-wage workers could suffer from increased economic hardship, translating to more demand for affordable homes and social support services.
Income disparity is also likely to continue unless structural wage disparities are tackled. The wage gap between men and women, and between low and high-income earners, continues to be a major concern.
Without stronger policies on wage fairness, job support, and cost-of-living regulation, lower-income households will find it difficult to keep pace with increasing costs.
Future policy changes, such as increased income support, progressive taxation, and affordable housing programs, will be crucial in alleviating financial pressure for lower-paid workers.
References
- Peninsula Group Limited. (n.d.). Minimum wage in Manitoba: An employer’s guide. Retrieved from https://www.peninsulagrouplimited.com/ca/resource-hub/minimum-wage/minimum-wage-in-manitoba-an-employers-guide/
- Calcul Conversion. (n.d.). Minimum wage Manitoba calculator. Retrieved from https://www.calculconversion.com/minimum-wage-manitoba-calculator.html
- Retail Council of Canada. (n.d.). Minimum wage by province. Retrieved from https://www.retailcouncil.org/resources/quick-facts/minimum-wage-by-province/
- AreaVibes. (n.d.). Most expensive neighborhoods in Winnipeg, MB. Retrieved from https://www.areavibes.com/winnipeg-mb/most-expensive-neighborhoods/
- Institute for Research on Public Policy. (2024, July). Income and wealth inequality. Policy Options. Retrieved from https://policyoptions.irpp.org/magazines/july-2024/income-wealth-inequality/
- Statistics Canada. (n.d.). Table 11-10-0239-01: Total income, by economic family type and income source, Canada, provinces and selected census metropolitan areas. Retrieved from https://www150.statcan.gc.ca/t1/tbl1/en/tv.action?pid=1110023901&pickMembers%5B0%5D=1.10&pickMembers%5B1%5D=2.1&pickMembers%5B2%5D=3.3&pickMembers%5B3%5D=4.1&cubeTimeFrame.startYear=2018&cubeTimeFrame.endYear=2022&referencePeriods=20180101%2C20220101
- City of Winnipeg. (n.d.). Poverty reduction strategy. Retrieved from https://engage.winnipeg.ca/poverty-reduction-strategy
- Government of Manitoba. (2015). Budget 2015: Poverty reduction strategy. Retrieved from https://www.gov.mb.ca/finance/budget15/papers/poverty.pdf
- Government of Manitoba. (n.d.). Manitoba’s poverty reduction strategy. Retrieved from https://www.gov.mb.ca/povertyreduction/